Pharmacology: Mechanism of Action: Sodium-glucose co-transporter 2 (SGLT2), expressed in the proximal renal tubules, is responsible for the majority of the reabsorption of filtered glucose from the tubular lumen. Canagliflozin is an inhibitor of SGLT2. By inhibiting SGLT2, canagliflozin reduces reabsorption of filtered glucose and lowers the renal threshold for glucose (RT
G), and thereby increases urinary glucose excretion (UGE).
Pharmacodynamics: Following single and multiple oral doses of canagliflozin in patients with type 2 diabetes, dose-dependent decreases in the renal threshold for glucose (RT
G) and increases in urinary glucose excretion were observed. From a starting RT
G value of approximately 240 mg/dL, canagliflozin at 100 mg and 300 mg once daily suppressed RT
G throughout the 24-hour period. Maximal suppression of mean RT
G over the 24-hour period was seen with the 300 mg daily dose to approximately 70 to 90 mg/dL in patients with type 2 diabetes in Phase 1 trials. The reductions in RT
G led to increases in mean UGE of approximately 100 g/day in subjects with type 2 diabetes treated with either 100 mg or 300 mg of canagliflozin. In patients with type 2 diabetes given 100 to 300 mg once daily over a 16-day dosing period, reductions in RT
G and increases in urinary glucose excretion were observed over the dosing period. In this trial, plasma glucose declined in a dose-dependent fashion within the first day of dosing. In single-dose trials in healthy and type 2 diabetic subjects, treatment with canagliflozin 300 mg before a mixed-meal delayed intestinal glucose absorption and reduced postprandial glucose.
Cardiac Electrophysiology: In a randomized, double-blind, placebo-controlled, active-comparator, 4-way crossover trial, 60 healthy subjects were administered a single oral dose of canagliflozin 300 mg, canagliflozin 1,200 mg (4 times the maximum recommended dose), moxifloxacin, and placebo. No meaningful changes in QTc interval were observed with either the recommended dose of 300 mg or the 1,200 mg dose.
Clinical Studies: INVOKANA (canagliflozin) has been studied as monotherapy, in combination with metformin, sulfonylurea, metformin and sulfonylurea, metformin and sitagliptin, metformin and a thiazolidinedione (i.e., pioglitazone), and in combination with insulin (with or without other anti-hyperglycemic agents). The efficacy of INVOKANA was compared to a dipeptidyl peptidase-4 (DPP-4) inhibitor (sitagliptin), both as add-on combination therapy with metformin and sulfonylurea, and a sulfonylurea (glimepiride), both as add-on combination therapy with metformin. INVOKANA was also evaluated in adults 55 to 80 years of age and patients with moderate renal impairment.
In patients with type 2 diabetes, treatment with INVOKANA produced clinically and statistically significant improvements in HbA
1C compared to placebo. Reductions in HbA
1C were observed across subgroups including age, gender, race, and baseline body mass index (BMI).
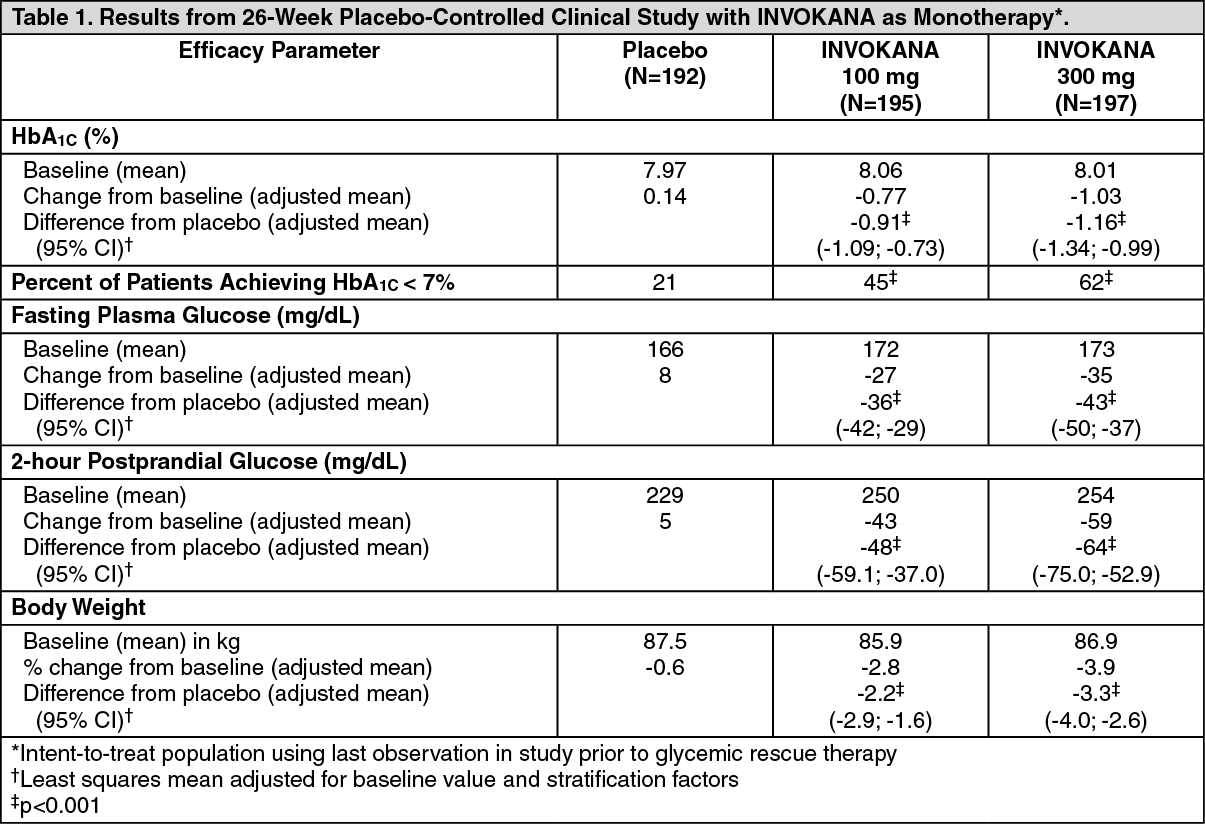
Glycemic Control Trials in Adults with Type 2 Diabetes Mellitus: Monotherapy: A total of 584 patients with type 2 diabetes inadequately controlled on diet and exercise participated in a 26-week, double-blind, placebo-controlled trial to evaluate the efficacy and safety of INVOKANA. The mean age was 55 years, 44% of patients were men, and the mean baseline eGFR was 87 mL/min/1.73 m
2. Patients taking other antihyperglycemic agents (N=281) discontinued the agent and underwent an 8-week washout followed by a 2-week, single-blind, placebo run-in period. Patients not taking oral antihyperglycemic agents (N=303) entered the 2-week, single-blind, placebo run-in period directly. After the placebo run-in period, patients were randomized to INVOKANA 100 mg, INVOKANA 300 mg, or placebo, administered once daily for 26 weeks.
At the end of treatment, INVOKANA 100 mg and 300 mg once daily resulted in a statistically significant improvement in HbA
1C (p<0.001 for both doses) compared to placebo. INVOKANA 100 mg and 300 mg once daily also resulted in a greater proportion of patients achieving an HbA
1C less than 7%, in significant reduction in fasting plasma glucose (FPG), in improved postprandial glucose (PPG) and in percent body weight reduction compared to placebo (see Table 1). Statistically significant (p<0.001 for both doses) mean changes from baseline in systolic blood pressure relative to placebo were -3.7 mmHg and -5.4 mmHg with INVOKANA 100 mg and 300 mg, respectively. (See Table 1.)
 Click on icon to see table/diagram/image
Add-on Combination Therapy with Metformin:
A total of 1,284 patients with type 2 diabetes inadequately controlled on metformin monotherapy (greater than or equal to 2,000 mg/day or at least 1,500 mg/day if higher dose not tolerated) participated in a 26-week, double-blind, placebo- and active-controlled trial to evaluate the efficacy and safety of INVOKANA in combination with metformin. The mean age was 55 years, 47% of patients were men, and the mean baseline eGFR was 89 mL/min/1.73 m
2. Patients already on the required metformin dose (N=1009) were randomized after completing a 2-week, single-blind, placebo run-in period. Patients taking less than the required metformin dose or patients on metformin in combination with another antihyperglycemic agent (N=275) were switched to metformin monotherapy (at doses described previously) for at least 8 weeks before entering the 2-week, single-blind, placebo run-in. After the placebo run-in period, patients were randomized to INVOKANA 100 mg, INVOKANA 300 mg, sitagliptin 100 mg, or placebo, administered once daily as add-on therapy to metformin.
At the end of treatment, INVOKANA 100 mg and 300 mg once daily resulted in a statistically significant improvement in HbA
1C (p<0.001 for both doses) compared to placebo when added to metformin. INVOKANA 100 mg and 300 mg once daily also resulted in a greater proportion of patients achieving an HbA
1C less than 7%, in significant reduction in fasting plasma glucose (FPG), in improved postprandial glucose (PPG), and in percent body weight reduction compared to placebo when added to metformin (see Table 2). Statistically significant (p<0.001 for both doses) mean changes from baseline in systolic blood pressure relative to placebo were -5.4 mmHg and -6.6 mmHg with INVOKANA 100 mg and 300 mg, respectively. (See Table 2.)
Click on icon to see table/diagram/image
Initial Combination Therapy with Metformin: A total of 1,186 patients with type 2 diabetes inadequately controlled with diet and exercise participated in a 26-week double-blind, active-controlled, parallel-group, 5-arm, multicenter trial to evaluate the efficacy and safety of initial therapy with INVOKANA in combination with metformin XR. The median age was 56 years, 48% of patients were men, and the mean baseline eGFR was 87.6 mL/min/1.73 m
2. The median duration of diabetes was 1.6 years, and 72% of patients were treatment naïve. After completing a 2-week single-blind placebo run-in period, patients were randomly assigned for a double-blind treatment period of 26 weeks to 1 of 5 treatment groups (Table 3). The metformin XR dose was initiated at 500 mg/day for the first week of treatment and then increased to 1000 mg/day. Metformin XR or matching placebo was up-titrated every 2-3 weeks during the next 8 weeks of treatment to a maximum daily dose of 1500 to 2000 mg/day, as tolerated; about 90% of patients reached 2000 mg/day.
At the end of treatment, INVOKANA 100 mg and INVOKANA 300 mg in combination with metformin XR resulted in a statistically significant greater improvement in HbA
1C compared to their respective INVOKANA doses (100 mg and 300 mg) alone or metformin XR alone. (See Table 3.)
Click on icon to see table/diagram/image
INVOKANA Compared to Glimepiride, Both as Add-on Combination With Metformin: A total of 1,450 patients with type 2 diabetes inadequately controlled on metformin monotherapy (greater than or equal to 2,000 mg/day, or at least 1,500 mg/day if higher dose not tolerated) participated in a 52-week, double-blind, active-controlled trial to evaluate the efficacy and safety of INVOKANA in combination with metformin.
The mean age was 56 years, 52% of patients were men, and the mean baseline eGFR was 90 mL/min/1.73 m
2. Patients tolerating maximally required metformin dose (N=928) were randomized after completing a 2-week, single-blind, placebo run-in period. Other patients (N=522) were switched to metformin monotherapy (at doses described previously) for at least 10 weeks, then completed a 2-week single-blind run-in period. After the 2-week run-in period, patients were randomized to INVOKANA 100 mg, INVOKANA 300 mg, or glimepiride (titration allowed throughout the 52-week trial to 6 or 8 mg), administered once daily as add-on therapy to metformin.
As shown in Table 4 and Figure 1, at the end of treatment, INVOKANA 100 mg provided similar reductions in HbA
1C from baseline compared to glimepiride when added to metformin therapy. INVOKANA 300 mg provided a greater reduction from baseline in HbA
1C compared to glimepiride, and the relative treatment difference was -0.12% (95% CI: -0.22; -0.02). As shown in Table 4, treatment with INVOKANA 100 mg and 300 mg daily provided greater improvements in percent body weight change, relative to glimepiride. (See Table 4 and Figure 1.)
Click on icon to see table/diagram/image
Click on icon to see table/diagram/image
Add-on Combination Therapy With Sulfonylurea: A total of 127 patients with type 2 diabetes inadequately controlled on sulfonylurea monotherapy participated in an 18-week, double-blind, placebo-controlled sub-study to evaluate the efficacy and safety of INVOKANA in combination with sulfonylurea. The mean age was 65 years, 57% of patients were men, and the mean baseline eGFR was 69 mL/min/1.73 m
2. Patients treated with sulfonylurea monotherapy on a stable protocol-specified dose (greater than or equal to 50% maximal dose) for at least 10 weeks completed a 2-week, single-blind, placebo run-in period. After the run-in period, patients with inadequate glycemic control were randomized to INVOKANA 100 mg, INVOKANA 300 mg, or placebo, administered once daily as add-on to sulfonylurea.
As shown in Table 5, at the end of treatment, INVOKANA 100 mg and 300 mg daily provided statistically significant (p<0.001 for both doses) improvements in HbA
1C relative to placebo when added to sulfonylurea. INVOKANA 300 mg once daily compared to placebo resulted in a greater proportion of patients achieving an HbA
1C less than 7%, (33% vs 5%), greater reductions in fasting plasma glucose (-36 mg/dL vs +12 mg/dL), and greater percent body weight reduction (-2.0% vs -0.2%). (See Table 5.)
Click on icon to see table/diagram/image
Add-on Combination Therapy With Metformin and Sulfonylurea:
A total of 469 patients with type 2 diabetes inadequately controlled on the combination of metformin (greater than or equal to 2,000 mg/day or at least 1,500 mg/day if higher dose not tolerated) and sulfonylurea (maximal or near-maximal effective dose) participated in a 26-week, double-blind, placebo-controlled trial to evaluate the efficacy and safety of INVOKANA in combination with metformin and sulfonylurea. The mean age was 57 years, 51% of patients were men, and the mean baseline eGFR was 89 mL/min/1.73 m
2. Patients already on the protocol-specified doses of metformin and sulfonylurea (N=372) entered a 2-week, single-blind, placebo run-in period. Other patients (N=97) were required to be on a stable protocol-specified dose of metformin and sulfonylurea for at least 8 weeks before entering the 2-week run-in period. Following the run-in period, patients were randomized to INVOKANA 100 mg, INVOKANA 300 mg, or placebo, administered once daily as add-on to metformin and sulfonylurea.
At the end of treatment, INVOKANA 100 mg and 300 mg once daily resulted in a statistically significant improvement in HbA
1C (p<0.001 for both doses) compared to placebo when added to metformin and sulfonylurea. INVOKANA 100 mg and 300 mg once daily also resulted in a greater proportion of patients achieving an HbA
1C less than 7%, in a significant reduction in fasting plasma glucose (FPG), and in percent body weight reduction compared to placebo when added to metformin and sulfonylurea (see Table 6).
Click on icon to see table/diagram/image
Add-on Combination Therapy With Metformin and Sitagliptin: A total of 217 patients with type 2 diabetes inadequately controlled on the combination of metformin (greater than or equal to 1,500 mg/day) and sitagliptin 100 mg/day (or equivalent fixed-dose combination) participated in a 26-week, double-blind, placebo-controlled trial to evaluate the efficacy and safety of INVOKANA in combination with metformin and sitagliptin. The mean age was 57 years, 58% of patients were men, 73% of patients were Caucasian, 15% were Asian, and 12% were Black or African-American. The mean baseline eGFR was 90 mL/min/1.73 m
2 and the mean baseline BMI was 32 kg/m
2. The mean duration of diabetes was 10 years. Eligible patients entered a 2-week, single-blind, placebo run-in period and were subsequently randomized to INVOKANA 100 mg or placebo, administered once daily as add-on to metformin and sitagliptin. Patients with a baseline eGFR of 70 mL/min/1.73 m
2 or greater who were tolerating INVOKANA 100 mg and who required additional glycemic control (fasting finger stick 100 mg/dL or greater at least twice within 2 weeks) were up-titrated to INVOKANA 300 mg. While up-titration occurred as early as Week 4, most (90%) patients randomized to INVOKANA were up-titrated to INVOKANA 300 mg by 6 to 8 weeks.
At the end of 26 weeks, INVOKANA resulted in a statistically significant improvement in HbA
1C (p<0.001) compared to placebo when added to metformin and sitagliptin. (See Table 7.)
Click on icon to see table/diagram/image
INVOKANA Compared to Sitagliptin, Both as Add-on Combination Therapy With Metformin and Sulfonylurea: A total of 755 patients with type 2 diabetes inadequately controlled on the combination of metformin (greater than or equal to 2,000 mg/day or at least 1,500 mg/day if higher dose not tolerated) and sulfonylurea (near-maximal or maximal effective dose) participated in a 52-week, double-blind, active-controlled trial to compare the efficacy and safety of INVOKANA 300 mg versus sitagliptin 100 mg in combination with metformin and sulfonylurea. The mean age was 57 years, 56% of patients were men, and the mean baseline eGFR was 88 mL/min/1.73 m
2. Patients already on protocol-specified doses of metformin and sulfonylurea (N=716) entered a 2-week single-blind, placebo run-in period. Other patients (N=39) were required to be on a stable protocol-specified dose of metformin and sulfonylurea for at least 8 weeks before entering the 2-week run-in period. Following the run-in period, patients were randomized to INVOKANA 300 mg or sitagliptin 100 mg as add-on to metformin and sulfonylurea.
As shown in Table 8 and Figure 2, at the end of treatment, INVOKANA 300 mg provided greater HbA
1C reduction compared to sitagliptin 100 mg when added to metformin and sulfonylurea (p<0.05). INVOKANA 300 mg resulted in a mean percent change in body weight from baseline of -2.5% compared to +0.3% with sitagliptin 100 mg. A mean change in systolic blood pressure from baseline of -5.06 mmHg was observed with INVOKANA 300 mg compared to +0.85 mmHg with sitagliptin 100 mg. (See Table 8 and Figure 2.)
Click on icon to see table/diagram/image
Click on icon to see table/diagram/image
Add-on Combination Therapy With Metformin and Pioglitazone: A total of 342 patients with type 2 diabetes inadequately controlled on the combination of metformin (greater than or equal to 2,000 mg/day or at least 1,500 mg/day if higher dose not tolerated) and pioglitazone (30 or 45 mg/day) participated in a 26-week, double-blind, placebo-controlled trial to evaluate the efficacy and safety of INVOKANA in combination with metformin and pioglitazone. The mean age was 57 years, 63% of patients were men, and the mean baseline eGFR was 86 mL/min/1.73 m
2. Patients already on protocol-specified doses of metformin and pioglitazone (N=163) entered a 2-week, single-blind, placebo run-in period. Other patients (N=181) were required to be on stable protocol-specified doses of metformin and pioglitazone for at least 8 weeks before entering the 2-week run-in period. Following the run-in period, patients were randomized to INVOKANA 100 mg, INVOKANA 300 mg, or placebo, administered once daily as add-on to metformin and pioglitazone.
At the of end of treatment, INVOKANA 100 mg and 300 mg once daily resulted in a statistically significant improvement in HbA
1C (p<0.001 for both doses) compared to placebo when added to metformin and pioglitazone. INVOKANA 100 mg and 300 mg once daily also resulted in a greater proportion of patients achieving an HbA
1C less than 7%, in significant reduction in fasting plasma glucose (FPG) and in percent body weight reduction compared to placebo when added to metformin and pioglitazone (see Table 9). Statistically significant (p<0.05 for both doses) mean changes from baseline in systolic blood pressure relative to placebo were -4.1 mmHg and -3.5 mmHg with INVOKANA 100 mg and 300 mg, respectively. (See Table 9.)
Click on icon to see table/diagram/image
Add-On Combination Therapy With Insulin (With or Without Other Antihyperglycemic Agents):
A total of 1,718 patients with type 2 diabetes inadequately controlled on insulin greater than or equal to 30 units/day or insulin in combination with other antihyperglycemic agents participated in an 18-week, double-blind, placebo-controlled substudy of a cardiovascular trial to evaluate the efficacy and safety of INVOKANA in combination with insulin. The mean age was 63 years, 66% of patients were men, and the mean baseline eGFR was 75 mL/min/1.73 m
2. Patients on basal, bolus, or basal/bolus insulin for at least 10 weeks entered a 2-week, single-blind, placebo run-in period. Approximately 70% of patients were on a background basal/bolus insulin regimen. After the run-in period, patients were randomized to INVOKANA 100 mg, INVOKANA 300 mg, or placebo, administered once daily as add-on to insulin. The mean daily insulin dose at baseline was 83 units, which was similar across treatment groups.
At the of end of treatment, INVOKANA 100 mg and 300 mg once daily resulted in a statistically significant improvement in HbA
1C (p<0.001 for both doses) compared to placebo when added to insulin. INVOKANA 100 mg and 300 mg once daily also resulted in a greater proportion of patients achieving an HbA
1C less than 7%, in significant reductions in fasting plasma glucose (FPG), and in percent body weight reductions compared to placebo (see Table 10). Statistically significant (p<0.001 for both doses) mean changes from baseline in systolic blood pressure relative to placebo were -2.6 mmHg and -4.4 mmHg with INVOKANA 100 mg and 300 mg, respectively. (See Table 10.)
Click on icon to see table/diagram/image
Study in Patients Ages 55 to 80:
A total of 714 type 2 diabetes patients ages 55 to 80 years and inadequately controlled on current diabetes therapy (either diet and exercise alone or in combination with oral or parenteral agents) participated in a 26-week, double-blind, placebo-controlled trial to evaluate the efficacy and safety of INVOKANA in combination with current diabetes treatment. The mean age was 64 years, 55% of patients were men, and the mean baseline eGFR was 77 mL/min/1.73 m
2. Patients were randomized in a 1:1:1 ratio to the addition of INVOKANA 100 mg, INVOKANA 300 mg, or placebo, administered once daily. At the end of treatment, INVOKANA provided statistically significant improvements from baseline relative to placebo in HbA
1C (p<0.001 for both doses) of -0.57% (95% CI: -0.71%; -0.44%) for INVOKANA 100 mg and -0.70% (95% CI: -0.84%; -0.57%) for INVOKANA 300 mg [see Use in Elderly under Precautions].
Moderate Renal Impairment: A total of 269 patients with type 2 diabetes and a baseline eGFR of 30 mL/min/1.73 m
2 to less than 50 mL/min/1.73 m
2 inadequately controlled on current diabetes therapy participated in a 26-week, double-blind, placebo-controlled clinical trial to evaluate the efficacy and safety of INVOKANA in combination with current diabetes treatment (diet or antihyperglycemic agent therapy, with 95% of patients on insulin and/or sulfonylurea). The mean age was 68 years, 61% of patients were men, and the mean baseline eGFR was 39 mL/min/1.73 m
2. Patients were randomized in a 1:1:1 ratio to the addition of INVOKANA 100 mg, INVOKANA 300 mg, or placebo, administered once daily.
At the end of treatment, INVOKANA 100 mg and INVOKANA 300 mg daily provided greater reductions in HbA
1C relative to placebo (-0.30% [95% CI: -0.53%; -0.07%] and -0.40%, [95% CI: -0.64%; -0.17%], respectively) [see Acute Kidney Injury and Renal Impairment under Precautions and Clinical Studies Experience under Adverse Reactions].
Cardiovascular Outcomes in Patients with Type 2 Diabetes Mellitus and Atherosclerotic Cardiovascular Disease: The CANVAS and CANVAS-R trials were multicenter, multinational, randomized, double-blind parallel group, with similar inclusion and exclusion criteria. Patients eligible for enrollment in both CANVAS and CANVAS-R trials were: 30 years of age or older and had established, stable, cardiovascular, cerebrovascular, peripheral artery disease (66% of the enrolled population) or were 50 years of age or older and had two or more other specified risk factors for cardiovascular disease (34% of the enrolled population).
The integrated analysis of the CANVAS and CANVAS-R trials compared the risk of Major Adverse Cardiovascular Event (MACE) between canagliflozin and placebo when these were added to and used concomitantly with standard of care treatments for diabetes and atherosclerotic cardiovascular disease. The primary endpoint, MACE, was the time to first occurrence of a three-part composite outcome which included cardiovascular death, non-fatal myocardial infarction and non-fatal stroke.
In CANVAS, patients were randomly assigned 1:1:1 to canagliflozin 100 mg, canagliflozin 300 mg, or matching placebo. In CANVAS-R, patients were randomly assigned 1:1 to canagliflozin 100 mg or matching placebo, and titration to 300 mg was permitted at the investigator's discretion (based on tolerability and glycemic needs) after Week 13. Concomitant antidiabetic and atherosclerotic therapies could be adjusted, at the discretion of investigators, to ensure participants were treated according to the standard care for these diseases.
A total of 10,134 patients were treated (4,327 in CANVAS and 5,807 in CANVAS-R; total of 4,344 randomly assigned to placebo and 5,790 to canagliflozin) and exposed for a mean of 149 weeks (exposed for a mean of 223 weeks [4.3 years] in CANVAS and 94 weeks [1.8 years] in CANVAS-R). Approximately 78% of the trial population was Caucasian, 13% was Asian, and 3% was Black. The mean age was 63 years and approximately 64% were male.
The mean HbA
1C at baseline was 8.2% and mean duration of diabetes was 13.5 years with 70% of patients having had diabetes for 10 years or more. Approximately 31%, 21% and 17% reported a past history of neuropathy, retinopathy and nephropathy, respectively, and the mean eGFR 76 mL/min/1.73 m
2. At baseline, patients were treated with one (19%) or more (80%) antidiabetic medications including metformin (77%), insulin (50%), and sulfonylurea (43%).
At baseline, the mean systolic blood pressure was 137 mmHg, the mean diastolic blood pressure was 78 mmHg, the mean LDL was 89 mg/dL, the mean HDL was 46 mg/dL, and the mean urinary albumin to creatinine ratio (UACR) was 115 mg/g. At baseline, approximately 80% of patients were treated with renin angiotensin system inhibitors, 53% with beta-blockers, 13% with loop diuretics, 36% with non-loop diuretics, 75% with statins, and 74% with antiplatelet agents (mostly aspirin). During the trial, investigators could modify anti-diabetic and cardiovascular therapies to achieve local standard of care treatment targets with respect to blood glucose, lipid, and blood pressure. More patients receiving canagliflozin compared to placebo initiated anti-thrombotics (5.2% vs 4.2%) and statins (5.8% vs 4.8%) during the trial.
For the primary analysis, a stratified Cox proportional hazards model was used to test for non-inferiority against a pre-specified risk margin of 1.3 for the hazard ratio of MACE.
In the integrated analysis of CANVAS and CANVAS-R trials, canagliflozin reduced the risk of first occurrence of MACE. The estimated hazard ratio (95% CI) for time to first MACE was 0.86 (0.75, 0.97). Refer to Table 11. Vital status was obtained for 99.6% of patients across the trials. The Kaplan-Meier curve depicting time to first occurrence of MACE is shown in Figure 3. (See Table 11 and Figure 3.)
Click on icon to see table/diagram/image
Click on icon to see table/diagram/image
Pharmacokinetics: The pharmacokinetics of canagliflozin is similar in healthy subjects and patients with type 2 diabetes. Following single-dose oral administration of 100 mg and 300 mg of INVOKANA, peak plasma concentrations (median T
max) of canagliflozin occurs within 1 to 2 hours post-dose. Plasma C
max and AUC of canagliflozin increased in a dose-proportional manner from 50 mg to 300 mg. The apparent terminal half-life (t
1/2) was 10.6 hours and 13.1 hours for the 100 mg and 300 mg doses, respectively. Steady-state was reached after 4 to 5 days of once-daily dosing with canagliflozin 100 mg to 300 mg. Canagliflozin does not exhibit time-dependent pharmacokinetics and accumulated in plasma up to 36% following multiple doses of 100 mg and 300 mg.
Absorption: The mean absolute oral bioavailability of canagliflozin is approximately 65%. Co-administration of a high-fat meal with canagliflozin had no effect on the pharmacokinetics of canagliflozin; therefore, INVOKANA may be taken with or without food. However, based on the potential to reduce postprandial plasma glucose excursions due to delayed intestinal glucose absorption, it is recommended that INVOKANA be taken before the first meal of the day [see Recommended Dosage under Dosage & Administration].
Distribution: The mean steady-state volume of distribution of canagliflozin following a single intravenous infusion in healthy subjects was 83.5 L, suggesting extensive tissue distribution. Canagliflozin is extensively bound to proteins in plasma (99%), mainly to albumin. Protein binding is independent of canagliflozin plasma concentrations. Plasma protein binding is not meaningfully altered in patients with renal or hepatic impairment.
Metabolism: O-glucuronidation is the major metabolic elimination pathway for canagliflozin, which is mainly glucuronidated by UGT1A9 and UGT2B4 to two inactive
O-glucuronide metabolites.
CYP3A4-mediated (oxidative) metabolism of canagliflozin is minimal (approximately 7%) in humans.
Excretion: Following administration of a single oral [
14C] canagliflozin dose to healthy subjects, 41.5%, 7.0%, and 3.2% of the administered radioactive dose was recovered in feces as canagliflozin, a hydroxylated metabolite, and an
O-glucuronide metabolite, respectively. Enterohepatic circulation of canagliflozin was negligible.
Approximately 33% of the administered radioactive dose was excreted in urine, mainly as
O-glucuronide metabolites (30.5%). Less than 1% of the dose was excreted as unchanged canagliflozin in urine. Renal clearance of canagliflozin 100 mg and 300 mg doses ranged from 1.30 to 1.55 mL/min.
Mean systemic clearance of canagliflozin was approximately 192 mL/min in healthy subjects following intravenous administration.
Special Populations: Renal Impairment:
A single-dose, open-label trial evaluated the pharmacokinetics of canagliflozin 200 mg in subjects with varying degrees of renal impairment (classified using the MDRD-eGFR formula) compared to healthy subjects.
Renal impairment did not affect the C
max of canagliflozin. Compared to healthy subjects (N=3; eGFR greater than or equal to 90 mL/min/1.73 m
2), plasma AUC of canagliflozin was increased by approximately 15%, 29%, and 53% in subjects with mild (N=10), moderate (N=9), and severe (N=10) renal impairment, respectively, (eGFR 60 to less than 90, 30 to less than 60, and 15 to less than 30 mL/min/1.73 m
2, respectively), but was similar for ESRD (N=8) subjects and healthy subjects.
Increases in canagliflozin AUC of this magnitude are not considered clinically relevant. The pharmacodynamic response to canagliflozin declines with increasing severity of renal impairment [see Contraindications and Acute Kidney Injury under Precautions].
Canagliflozin was negligibly removed by hemodialysis.
Hepatic Impairment:
Relative to subjects with normal hepatic function, the geometric mean ratios for C
max and AUC
∞ of canagliflozin were 107% and 110%, respectively, in subjects with Child-Pugh class A (mild hepatic impairment) and 96% and 111%, respectively, in subjects with Child-Pugh class B (moderate hepatic impairment) following administration of a single 300 mg dose of canagliflozin.
These differences are not considered to be clinically meaningful. There is no clinical experience in patients with Child-Pugh class C (severe) hepatic impairment [see Hepatic Impairment under Precautions].
Pharmacokinetic Effects of Age, Body Mass Index (BMI)/Weight, Gender and Race: Based on the population PK analysis with data collected from 1526 subjects, age, body mass index (BMI)/weight, gender, and race do not have a clinically meaningful effect on pharmacokinetics of canagliflozin [see Use in Elderly under Precautions].
Drug Interaction Studies: In Vitro Assessment of Drug Interactions:
Canagliflozin did not induce CYP450 enzyme expression (3A4, 2C9, 2C19, 2B6, and 1A2) in cultured human hepatocytes. Canagliflozin did not inhibit the CYP450 isoenzymes (1A2, 2A6, 2C19, 2D6, or 2E1) and weakly inhibited CYP2B6, CYP2C8, CYP2C9, and CYP3A4 based on
in vitro studies with human hepatic microsomes. Canagliflozin is a weak inhibitor of P-gp.
Canagliflozin is also a substrate of drug transporters P-glycoprotein (P-gp) and MRP2.
In Vivo Assessment of Drug Interactions: See Tables 12 and 13.
Click on icon to see table/diagram/image
Click on icon to see table/diagram/image
Toxicology: Nonclinical Toxicology: Carcinogenesis: Carcinogenicity was evaluated in 2-year studies conducted in CD1 mice and Sprague-Dawley rats. Canagliflozin did not increase the incidence of tumors in mice dosed at 10, 30, or 100 mg/kg (less than or equal to 14 times exposure from a 300 mg clinical dose).
Testicular Leydig cell tumors, considered secondary to increased luteinizing hormone (LH), increased significantly in male rats at all doses tested (10, 30, and 100 mg/kg). In a 12-week clinical trial, LH did not increase in males treated with canagliflozin.
Renal tubular adenoma and carcinoma increased significantly in male and female rats dosed 100 mg/kg, or approximately 12-times exposure from a 300 mg clinical dose. Also, adrenal pheochromocytoma increased significantly in males and numerically in females dosed 100 mg/kg. Carbohydrate malabsorption associated with high doses of canagliflozin was considered a necessary proximal event in the emergence of renal and adrenal tumors in rats. Clinical studies have not demonstrated carbohydrate malabsorption in humans at canagliflozin doses of up to 2-times the recommended clinical dose of 300 mg.
Mutagenesis: Canagliflozin was not mutagenic with or without metabolic activation in the Ames assay. Canagliflozin was mutagenic in the
in vitro mouse lymphoma assay with but not without metabolic activation. Canagliflozin was not mutagenic or clastogenic in an
in vivo oral micronucleus assay in rats and an
in vivo oral Comet assay in rats.
Impairment of Fertility: Canagliflozin had no effects on the ability of rats to mate and sire or maintain a litter up to the high dose of 100 mg/kg (approximately 14 times and 18 times the 300 mg clinical dose in males and females, respectively), although there were minor alterations in a number of reproductive parameters (decreased sperm velocity, increased number of abnormal sperm, slightly fewer corpora lutea, fewer implantation sites, and smaller litter sizes) at the highest dosage administered.


 Click on icon to see table/diagram/image
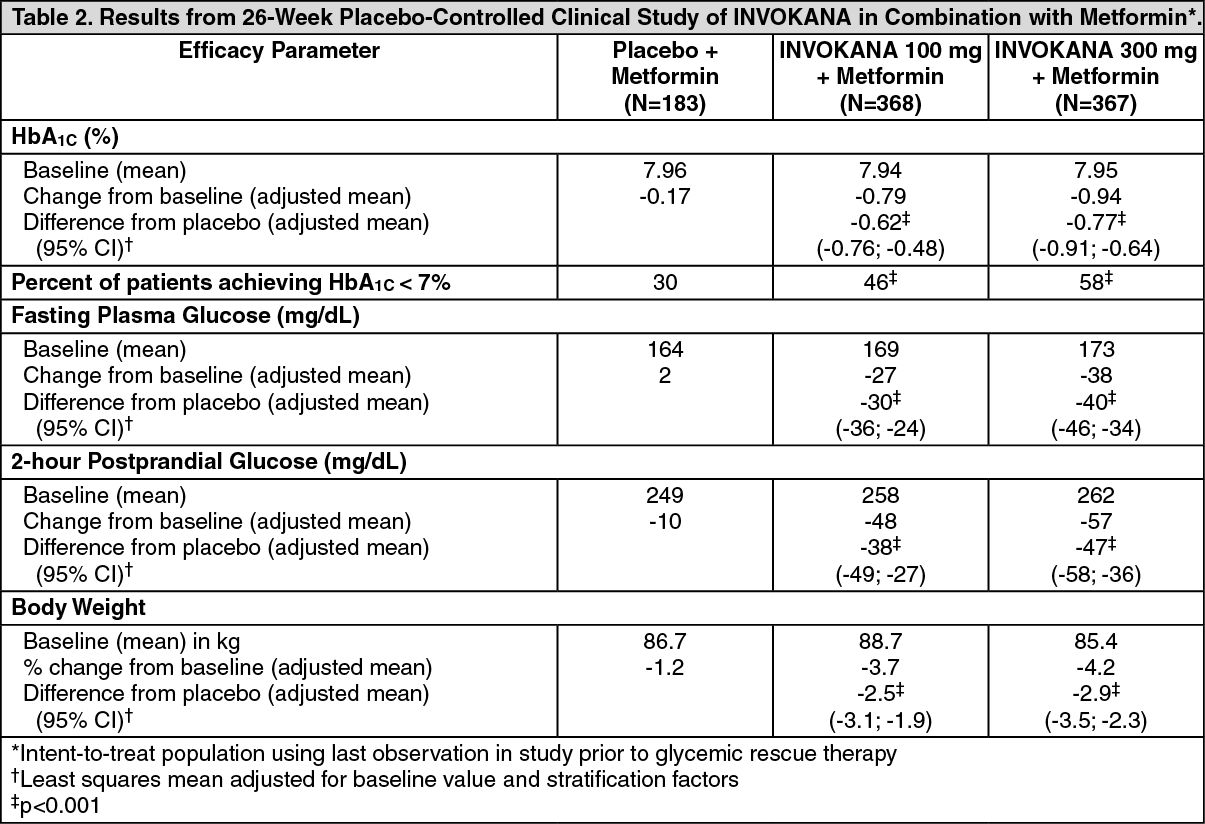 Click on icon to see table/diagram/image
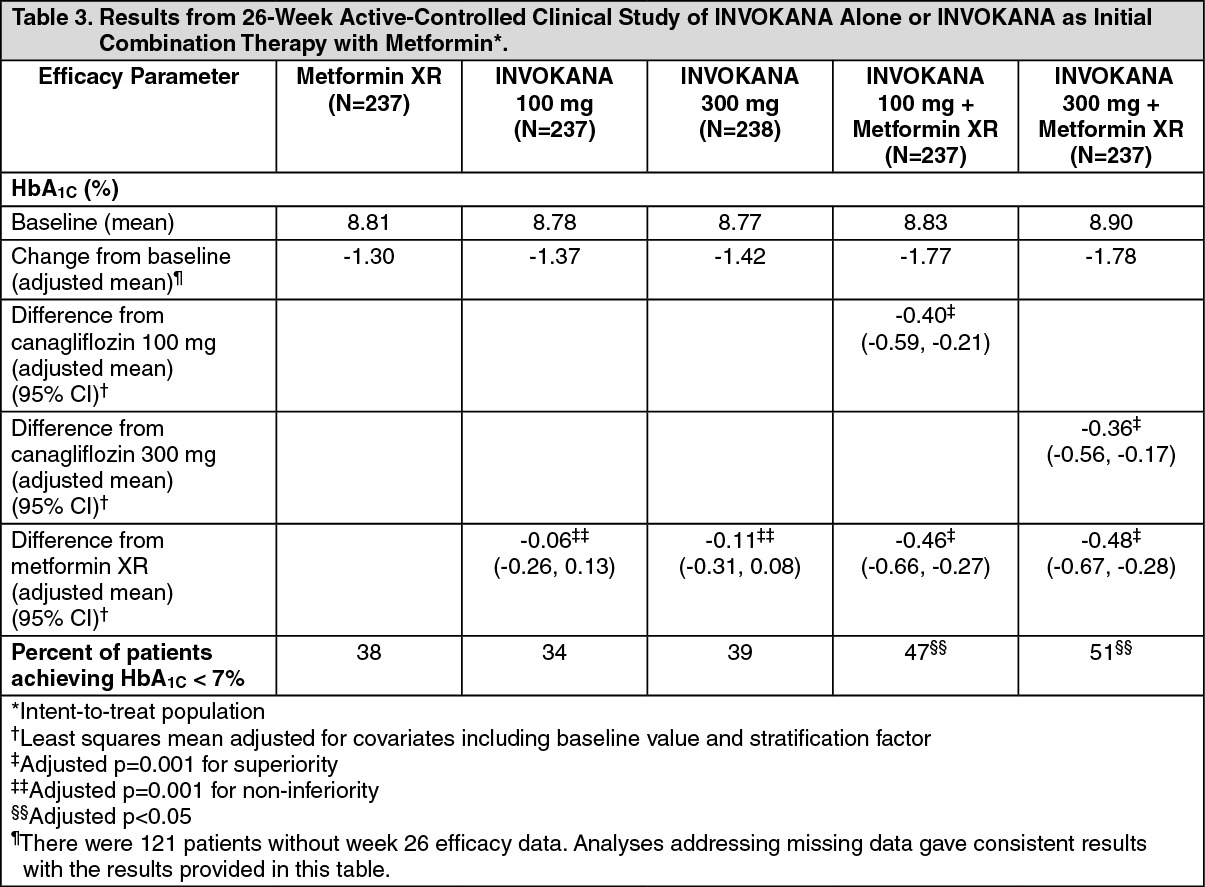 Click on icon to see table/diagram/image
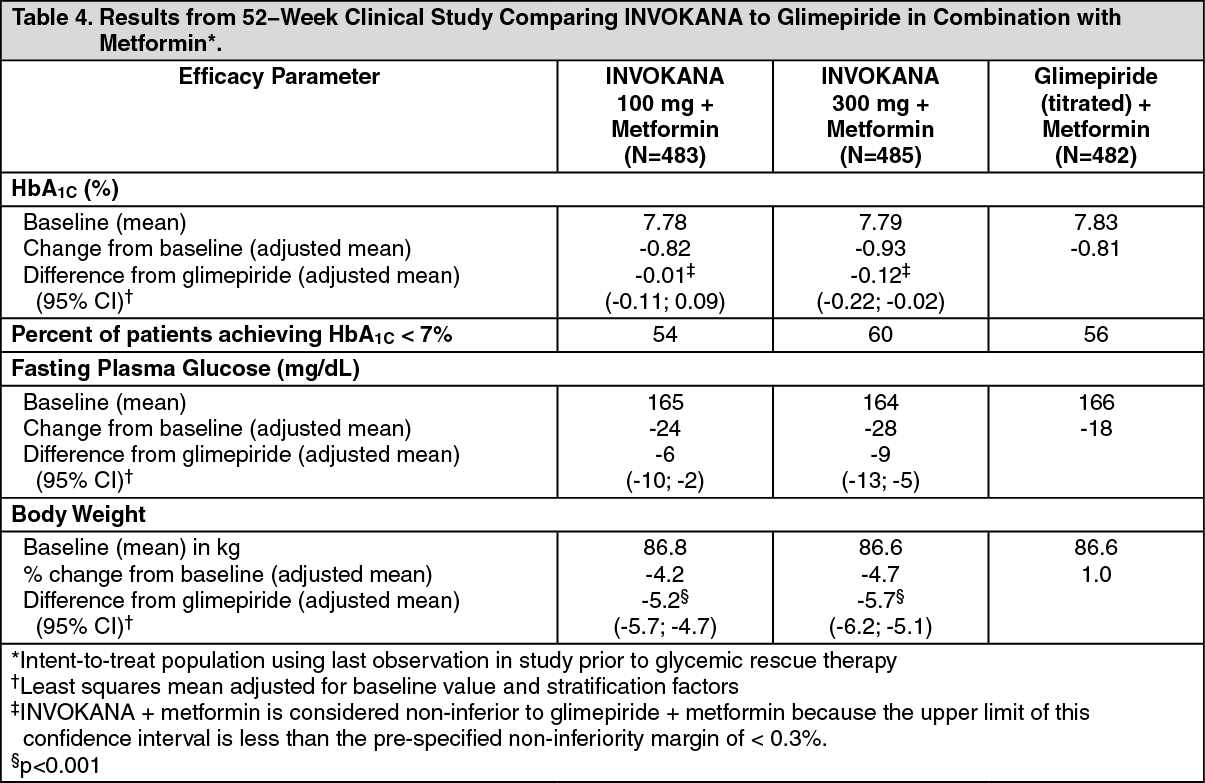 Click on icon to see table/diagram/image
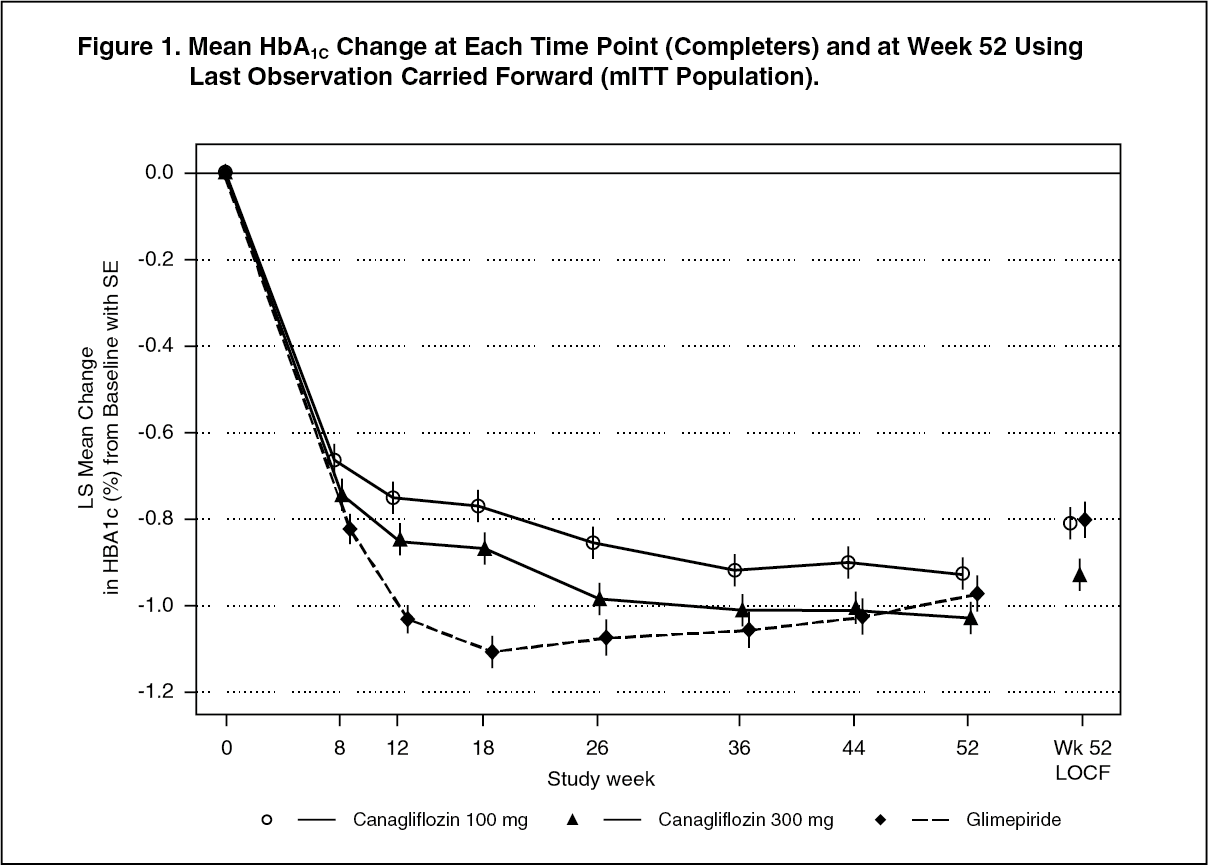 Click on icon to see table/diagram/image
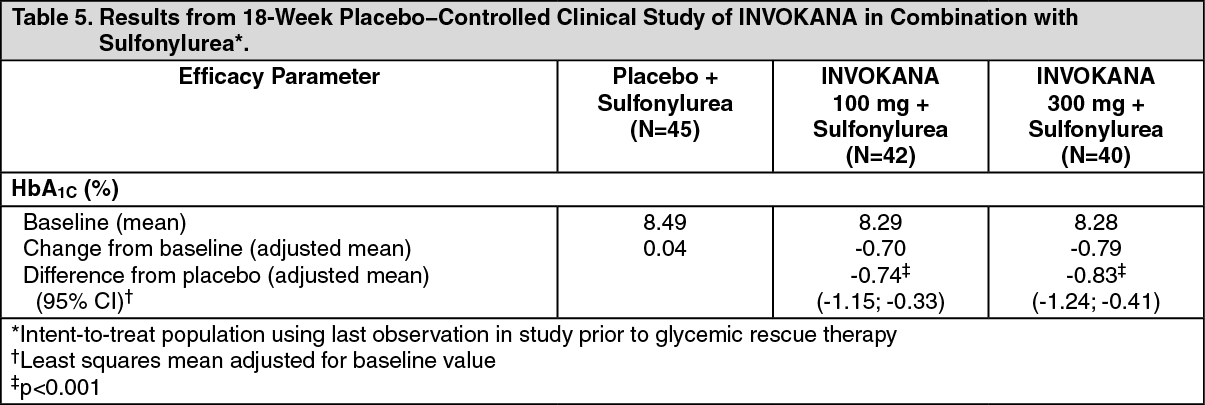 Click on icon to see table/diagram/image
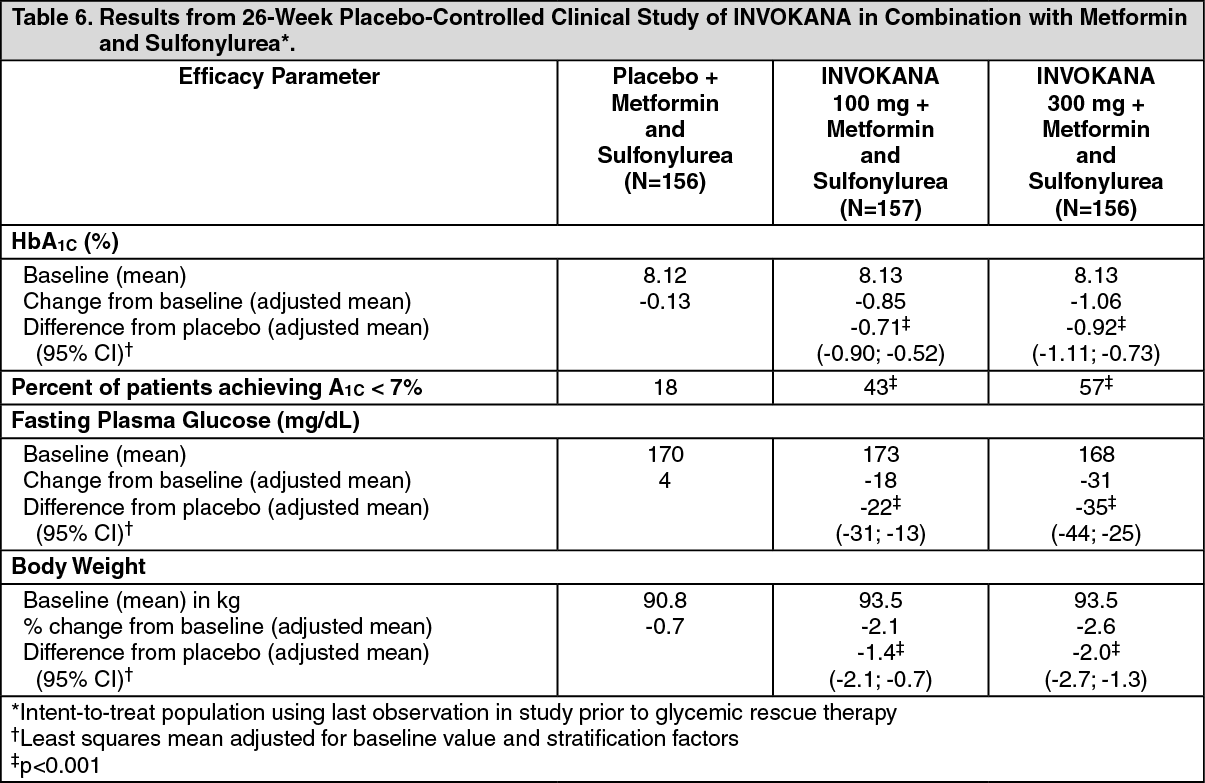 Click on icon to see table/diagram/image
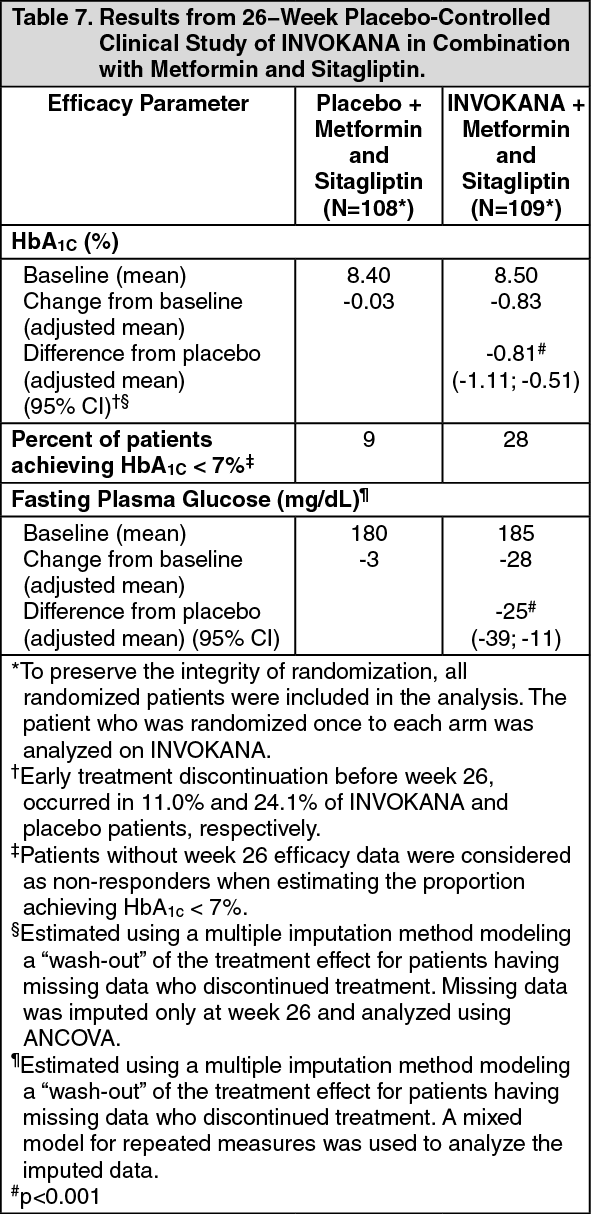 Click on icon to see table/diagram/image
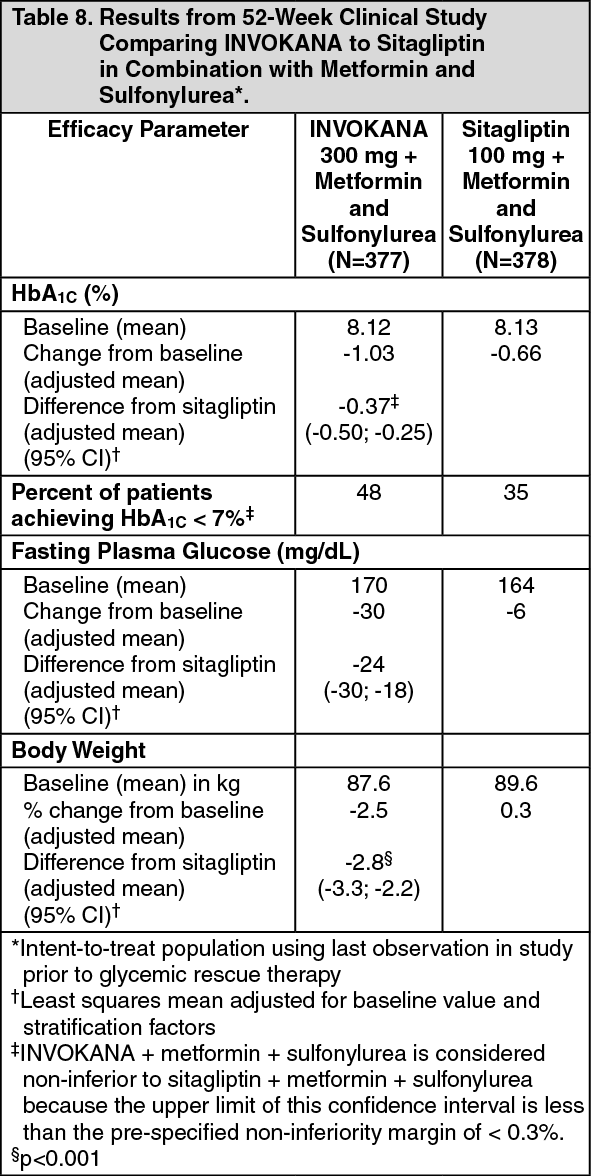 Click on icon to see table/diagram/image
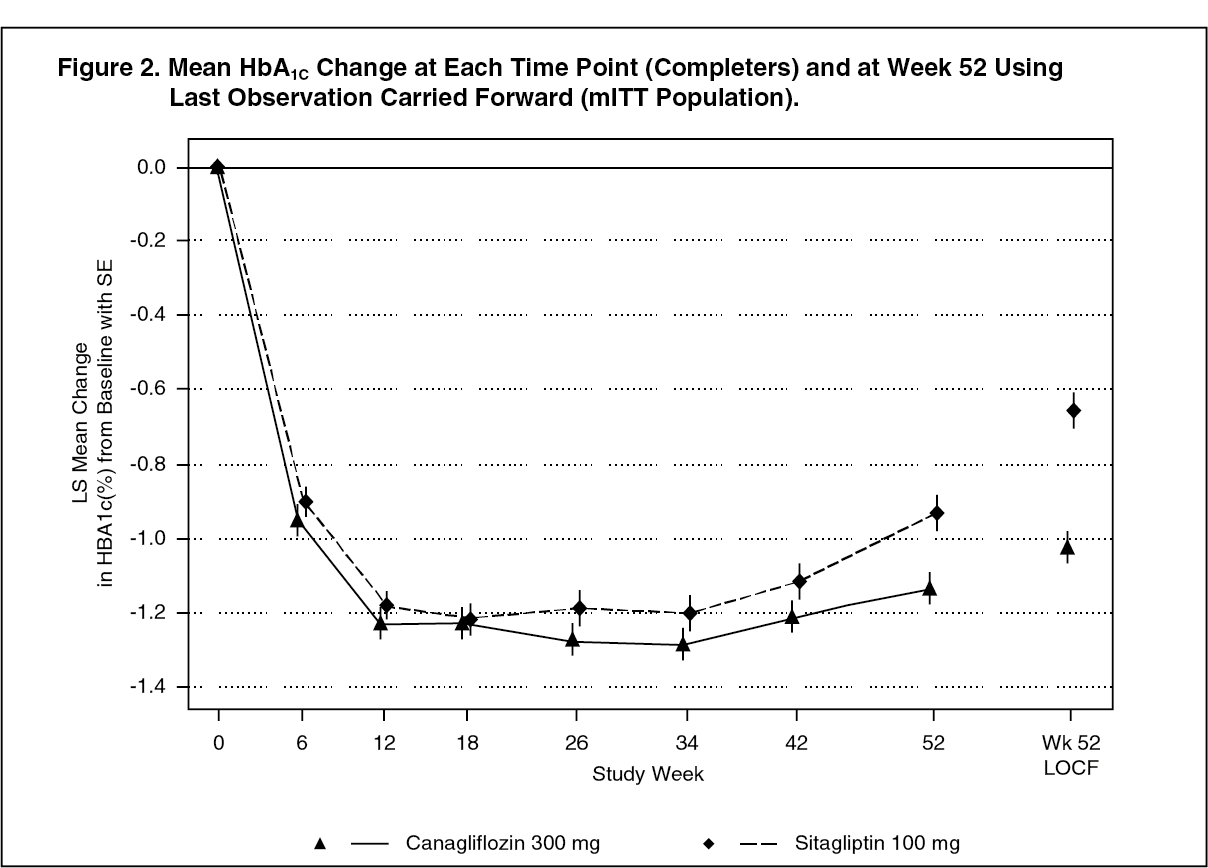 Click on icon to see table/diagram/image
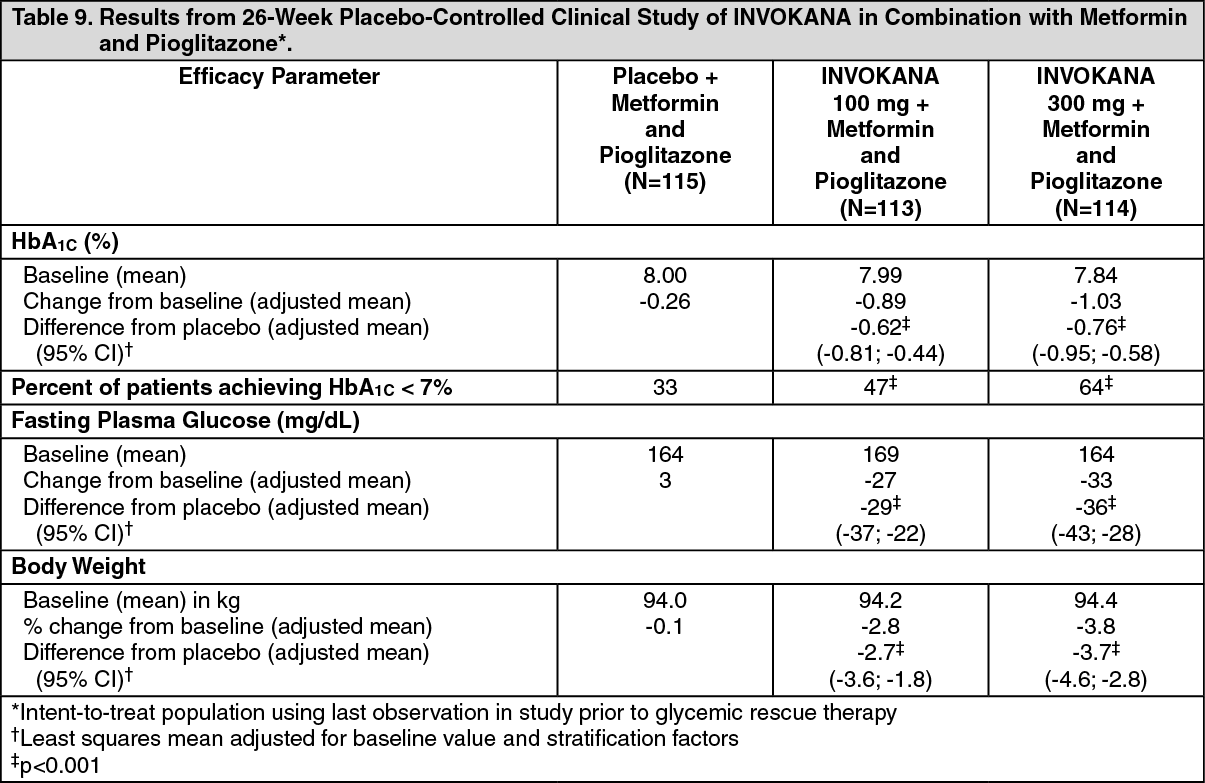 Click on icon to see table/diagram/image
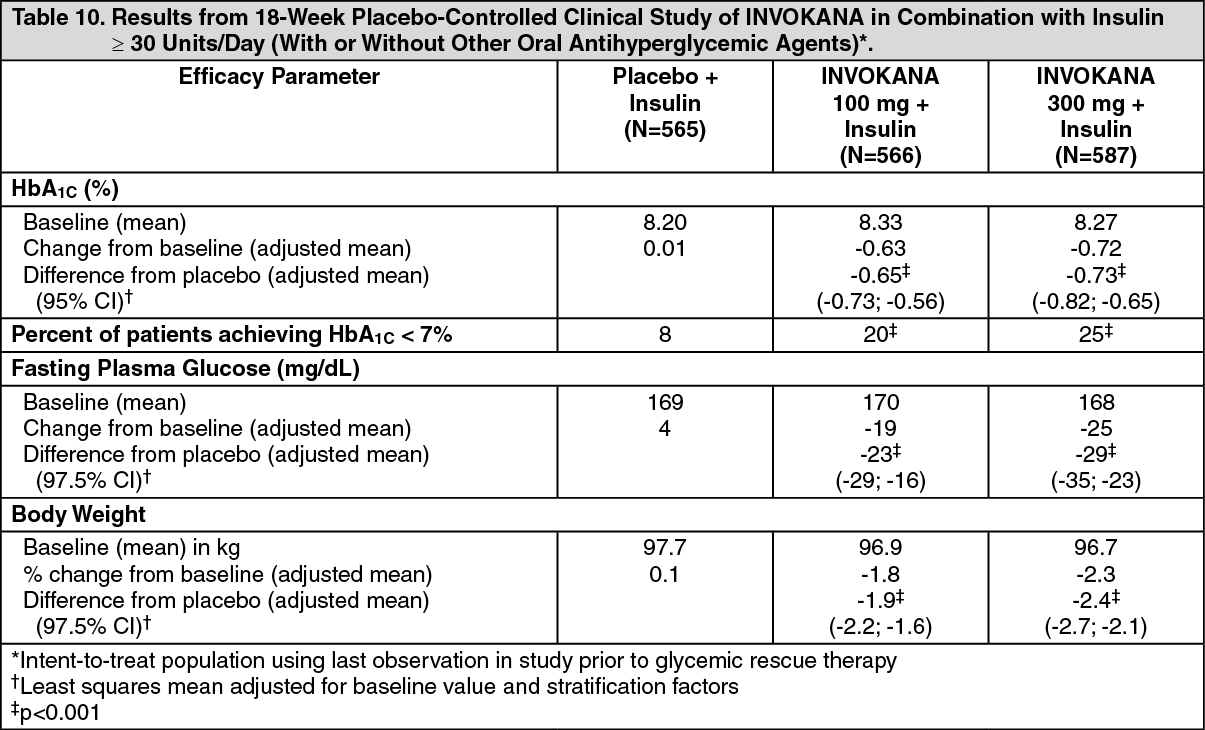 Click on icon to see table/diagram/image
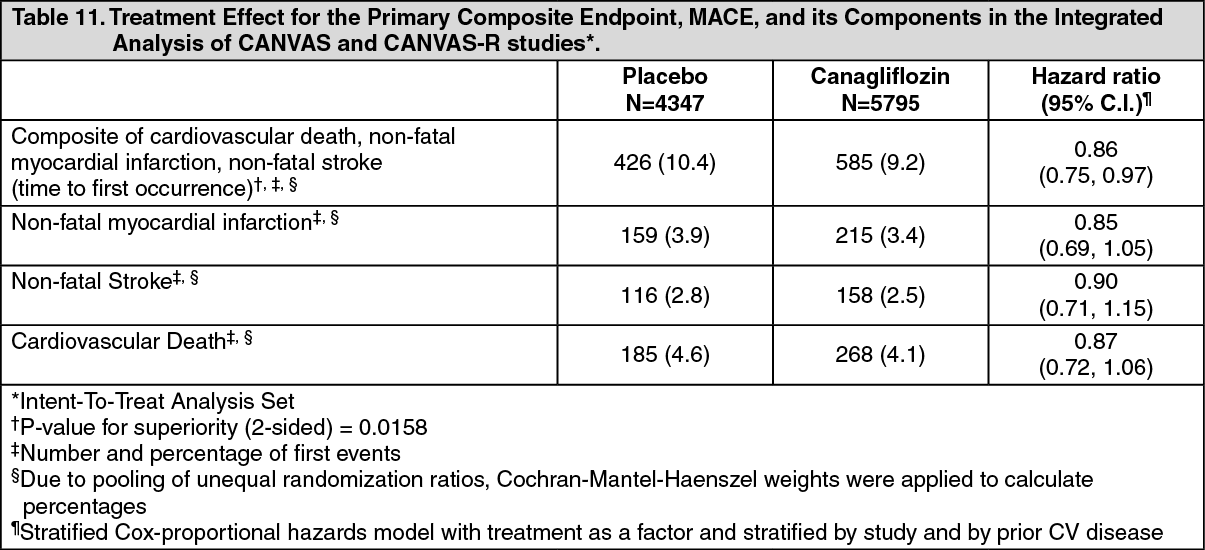 Click on icon to see table/diagram/image
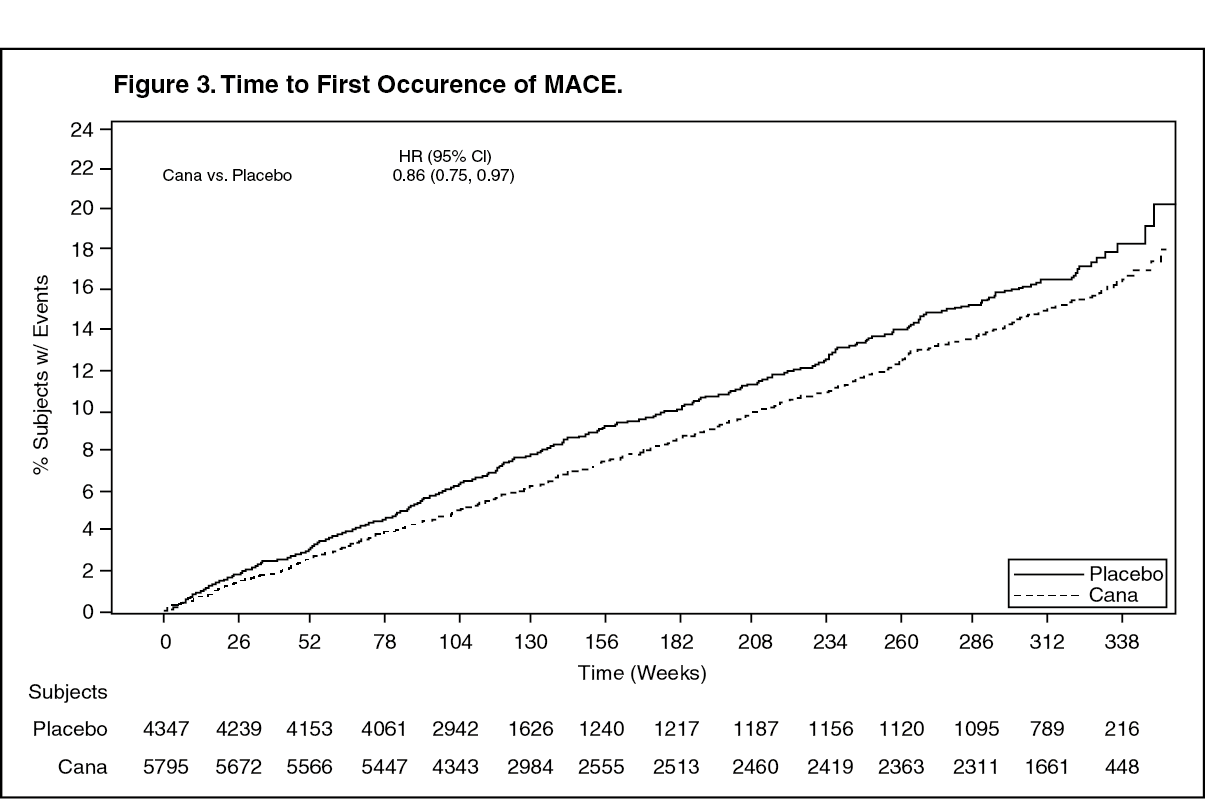 Click on icon to see table/diagram/image
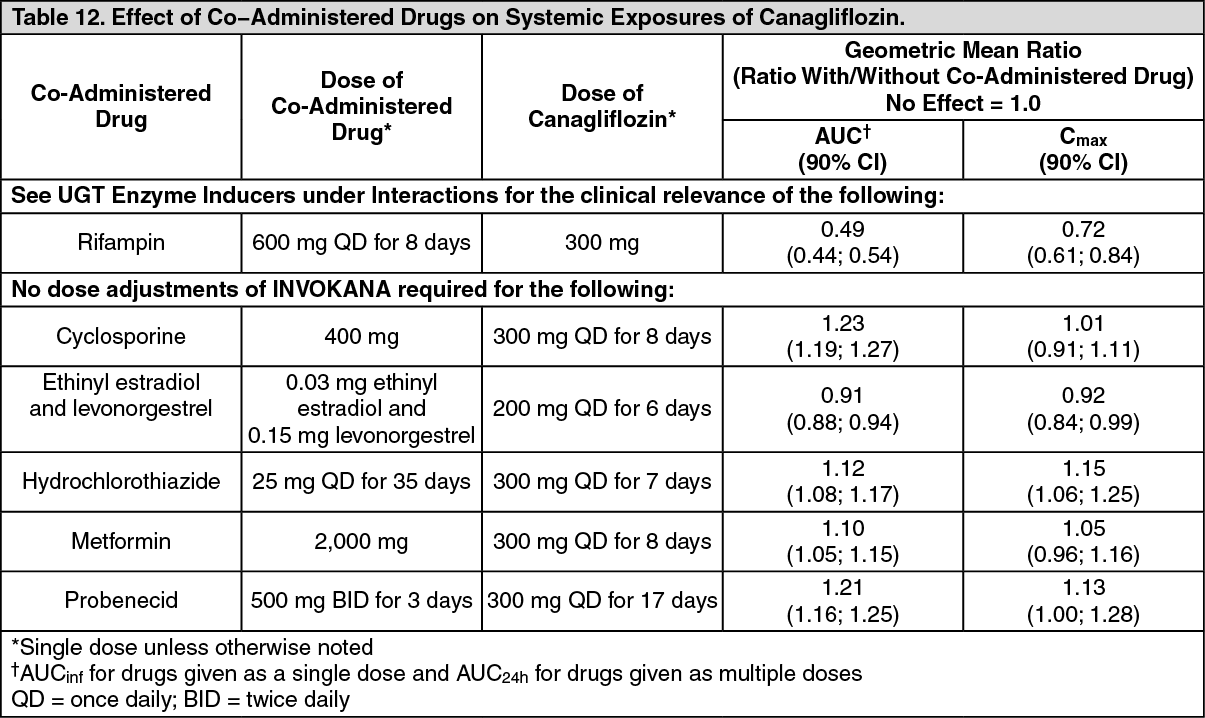 Click on icon to see table/diagram/image
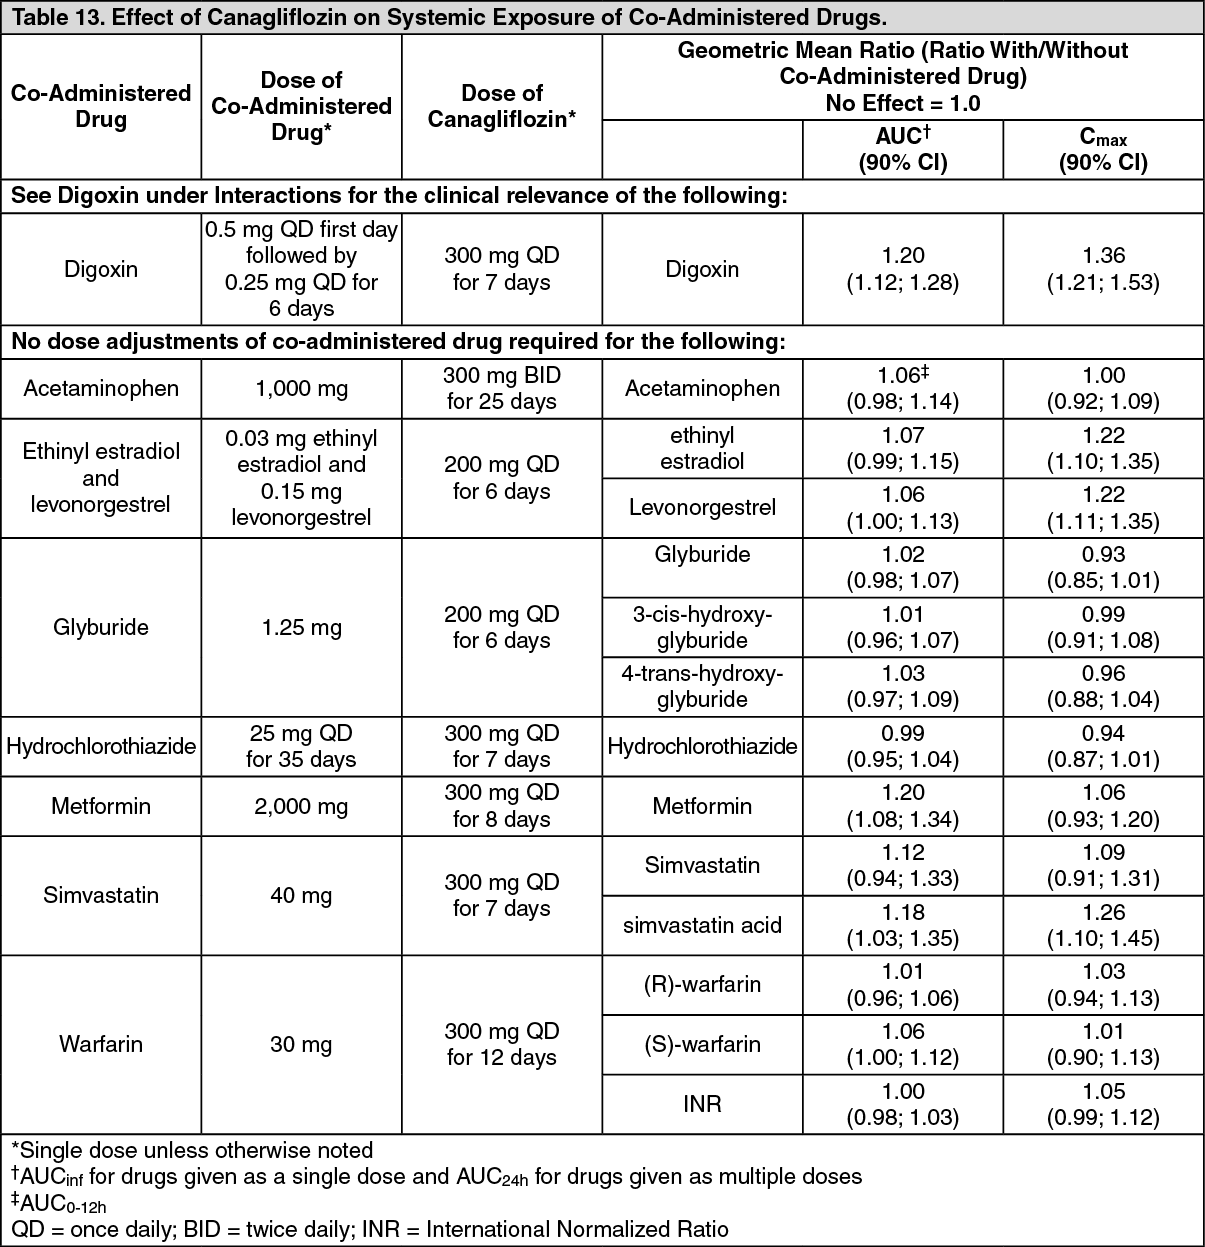 Click on icon to see table/diagram/image
 Click on icon to see table/diagram/image
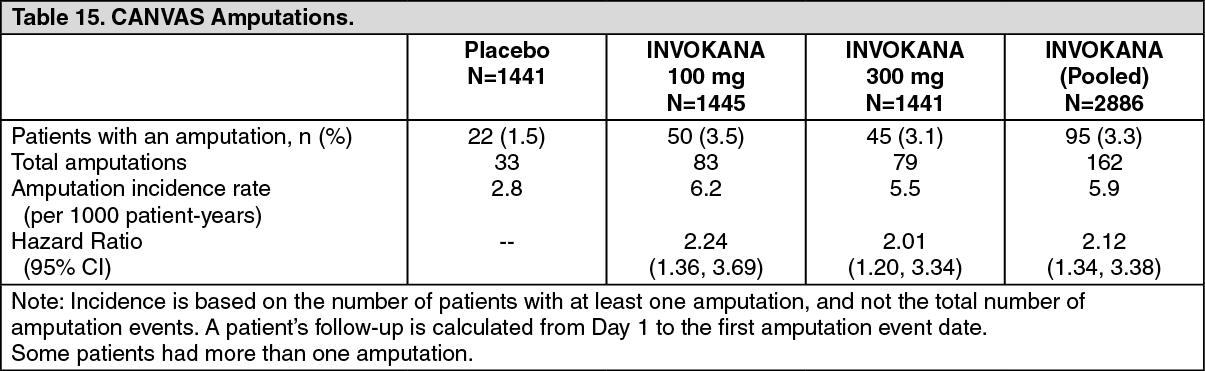 Click on icon to see table/diagram/image
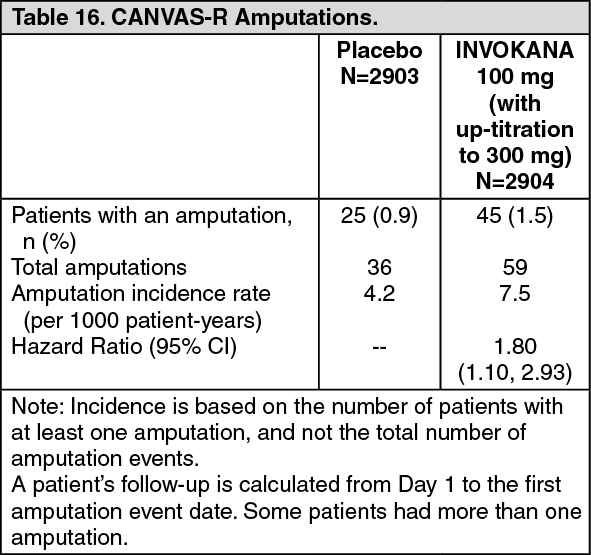 Click on icon to see table/diagram/image
 Click on icon to see table/diagram/image
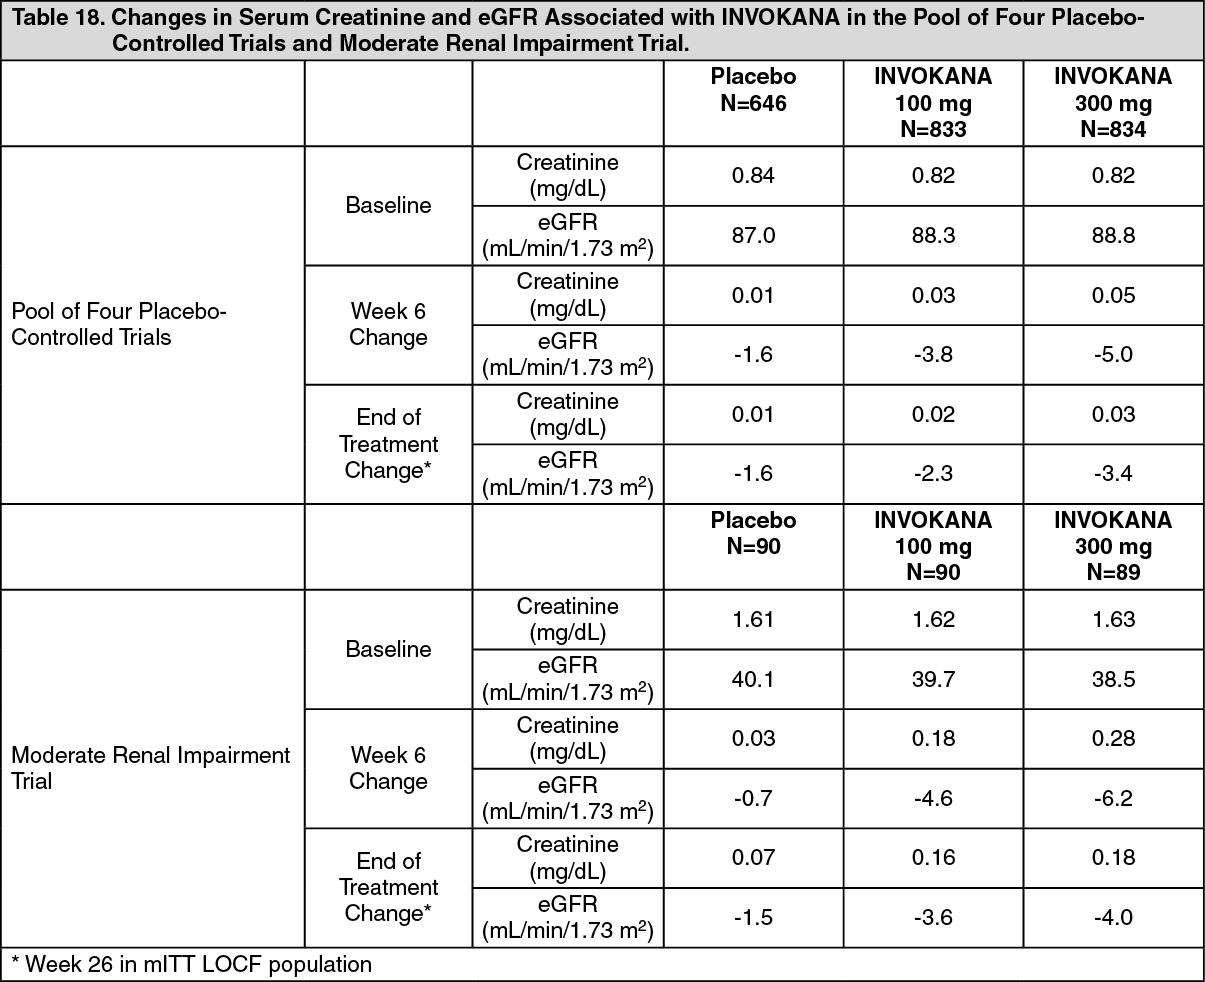 Click on icon to see table/diagram/image
 Click on icon to see table/diagram/image

 Sign Out