Protein kinase inhibitors.
Pharmacology: Mechanism of action: Everolimus is an inhibitor targeting mTOR (mammalian target of rapamycin), or more specifically, mTORC1 (mammalian 'target of rapamycin' complex 1). It exerts its activity through high affinity interaction with the intracellular receptor protein FKBP12. The FKBP12/everolimus complex binds to mTORC1, inhibiting its signaling capacity. mTOR is a key serine-threonine kinase playing a central role in the regulation of cell growth, proliferation and survival. The regulation of mTORC1 signaling is complex, being modulated by mitogens, growth factors, energy and nutrient availability. mTORC1 is an essential regulator of global protein synthesis downstream on the PI3K/AKT pathway, which is dysregulated in the majority of human cancers as well as genetic diseases such as TSC.
mTORC1 signaling is effected through modulation of the phosphorylation of downstream effectors, the best characterized of which are the translational regulators S6 ribosomal protein kinase (S6K1) and eukaryotic initiation factor 4E-binding protein (4E-BP1). Disruption of S6K1 and 4E-BP1 function, as a consequence of mTORC1 inhibition, interferes with the translation of mRNAs encoding pivotal proteins involved in cell cycle regulation, glycolysis and adaptation to low oxygen conditions (hypoxia). This inhibits tumor growth and expression of hypoxia-inducible factors (e.g. HIF-1 transcription factors); the latter resulting in reduced expression of factors involved in the potentiation of tumor angiogenic processes (e.g. the vascular endothelial growth factor VEGF) in multiple tumors such as RCC and angiomyolipoma). Two primary regulators of mTORC1 signaling are the oncogene suppressors tuberin-sclerosis complexes 1 & 2 (TSC1, TSC2). Loss or inactivation of either TSC1 or TSC2 leads to elevated rheb-GTP levels, a ras family GTPase, which interacts with the mTORC1 complex to cause its activation. mTORC1 activation leads to a downstream kinase signaling cascade, including activation of the S6K1. A substrate of mTOR complex 1 (mTORC1), S6K1 phosphorylates the estrogen receptor, which is responsible for ligand-independent receptor activation.
Everolimus is a potent inhibitor of the growth and proliferation of tumor cells, endothelial cells, fibroblasts and blood vessel-associated smooth muscle cells. Consistent with the central regulatory role of mTORC1, everolimus has been shown to reduce tumor cell proliferation, glycolysis and angiogenesis in solid tumors in vivo, and thus provides two independent mechanisms for inhibiting tumor growth: direct antitumor cell activity and inhibition of the tumor stromal compartment.
Activation of the mTOR pathway is a key adaptive change driving endocrine resistance in breast cancer. Various signal transduction pathways are activated to escape the effect of endocrine therapy. One pathway is the PI3K/Akt/mTOR pathway, which is constitutively activated in aromatase inhibitor (AI)-resistant and long-term estrogen-deprived breast cancer cells.
In vitro studies show that estrogen-dependent and HER2+ breast cancer cells are sensitive to the inhibitory effects of everolimus, and that combination treatment with everolimus and aromatase inhibitors enhances the anti-tumor activity of everolimus in a synergistic manner. In breast cancer cells, resistance to AIs due to Akt activation can be reversed by co-administration with everolimus.
In tuberous sclerosis syndrome, a genetic disorder, inactivating mutations in either the TSC1 or the TSC2 gene lead to hamartoma formation throughout the body as well as seizures and epileptogenesis. The mTOR regulates protein synthesis and multiple downstream cellular functions that may influence neuronal excitability and epileptogenesis. Overactivation of mTOR results in neuronal dysplasia, aberrant axonogenesis and dendrite formation, increased excitatory synaptic currents, reduced myelination, and disruption of the cortical laminar structure causing abnormalities in neuronal development and function. Preclinical studies in models of mTOR dysregulation in the brain demonstrated that treatment with an mTOR inhibitor such as everolimus could prolong survival, suppress seizures, prevent the development of new-onset seizures, and prevent premature death. In summary, everolimus is highly active in this neuronal model of TSC, with benefit apparently attributable to effects on mTORC1 inhibition.
Pharmacodynamics: There was a moderate correlation between the decrease in the phosphorylation of 4E-BP1 (P4-EBP1) in tumor tissue and the average everolimus C
min at steady state in blood after daily administration of 5 or 10 mg everolimus. Further data suggest that the inhibition of phosphorylation of the S6 kinase is very sensitive to the mTOR inhibition by everolimus. Inhibition of phosphorylation of elF-4G was complete at all C
min values after the 10 mg daily dose.
A trend suggestive of longer progression-free survival with higher time-normalized everolimus C
min (defined as (area under the C
min-time curve from study start to the time of the event)/(time from study start to the event)) was evident in patients with advanced pancreatic neuroendocrine tumors (pNET, risk ratio 0.73; 95% CI: 0.50 to 1.08) and in patients with advanced carcinoid tumor (risk ratio 0.66; 95% CI: 0.40 to 1.08). Everolimus C
min impacted the probability of tumor size reduction (p<0.001) with the odds ratios of 1.62 and 1.46, respectively, for a change in exposure from 5 ng/mL to 10 ng/mL in patients with advanced pNET and in patients with advanced carcinoid tumor.
In patients with TSC who have SEGA, a model based analysis indicated that a 2-fold C
min increase led to a 13% (95% CI: -18.2%, -7.5%) tumor size reduction from baseline, which was statistically significant at a 5% level.
In patients with TSC and refractory seizures, a conditional logistic regression analysis based on the core phase of Study M2304, to estimate the probability of seizure response vs. Time Normalized(TN)-C
min stratified by age subgroup indicated that a 2-fold increase in TN-C
min was associated with a 2.172-fold increase (95% CI: 1.339, 3.524) in the odds for a seizure response over the observed TN-C
min ranges of 0.97 ng/mL to 16.40 ng/mL. Baseline seizure frequency was a significant factor in the seizure response (with an odds ratio of 0.978 [95% CI: 0.959, 0.998]). This outcome was consistent with the results of a linear regression model predicting the log of absolute seizure frequency during the maintenance period of the core phase, which indicated that for a 2-fold increase in TN-C
min there was a statistically significant 28% reduction (95% CI: 12%, 42%) in absolute seizure frequency. Baseline seizure frequency and TN-C
min were both significant factors (α=0.05) in predicting the absolute seizure frequency in the linear regression model.
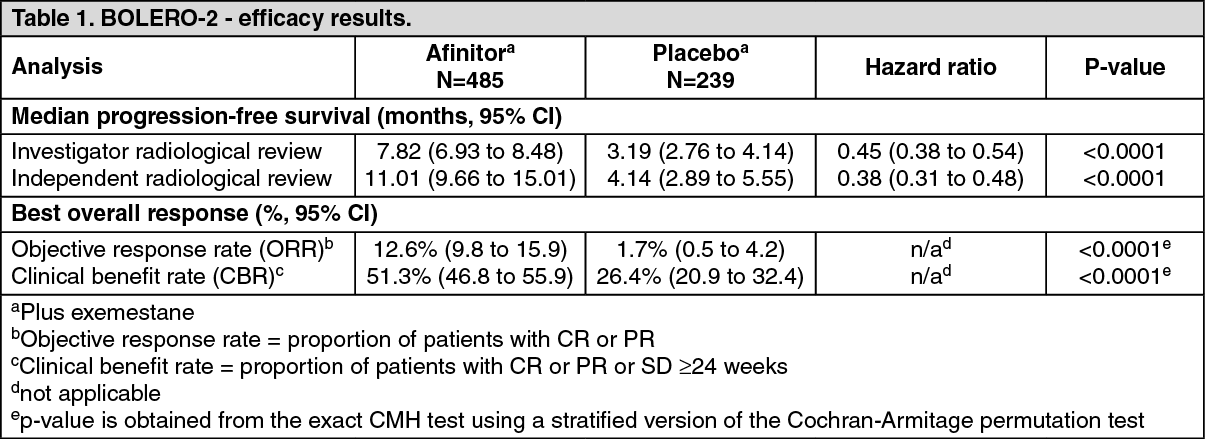
Clinical Studies: Hormone receptor-positive advanced breast cancer: BOLERO-2 (Study CRAD001Y2301), a randomized, double-blind, multicenter phase III study of Afinitor + exemestane versus placebo + exemestane was conducted in postmenopausal women with estrogen receptor-positive, HER 2-neu/non-amplified advanced breast cancer with recurrence or progression following prior therapy with letrozole or anastrozole.
The primary endpoint for the trial was progression-free survival (PFS) evaluated by Response Evaluation Criteria in Solid Tumors (RECIST), based on the investigators (local radiology) assessment. Supportive PFS analyses were based on an independent central radiology review.
Secondary endpoints included overall survival (OS), Overall Response Rate (ORR), Clinical Benefit Rate (CBR), Safety, change in Quality of Life (QoL) and time to ECOG PS deterioration. Additional endpoints included changes in bone turnover markers at 6 and 12 weeks.
A total of 724 patients were randomized in 2:1 ratio to the combination everolimus (10 mg daily) + exemestane (25 mg daily) (n=485) or placebo + exemestane arm (25 mg daily) (n=239). The two treatment groups were generally balanced with respect to the baseline demographics of disease characteristics and history of prior anti-neoplastic usages. The median age of patients was 61 years (range 28 to 93) and 75% were Caucasian. The median duration of blinded treatment was 24 weeks for patients receiving Afinitor plus exemestane and 13.4 weeks for those receiving placebo plus exemestane.
The efficacy results were obtained from the final analysis of PFS after 510 local PFS events and 320 central PFS events were observed. Patients in the placebo + exemestane arm did not cross-over to everolimus at the time of progression.
The study demonstrated a statistically significant clinical benefit of everolimus + exemestane over placebo + exemestane by a 2.5-fold prolongation in median PFS (see Table 1).
 Click on icon to see table/diagram/image
At the time of the final overall survival (OS) analysis, the median duration of OS was 31 months versus 26.6 months for the everolimus + exemestane arm versus the placebo + exemestane arm, respectively [HR= 0.89 (95% CI: 0.73 to 1.10; p=0.1426)].
Twelve-month PFS rates were 33% of patients receiving everolimus + exemestane compared with 11% in the placebo + exemestane arm.
Tumor reduction was also evident in 70.8% of patients in the everolimus + exemestane arm versus 29.7% for placebo + exemestane.
Clinically or statistically significant differences were not observed between the two treatment arms in terms of time to deterioration of ECOG PS (≥1 point) and median times to deterioration (≥5%) of QLQ-C30 domain scores.
Effects on bone: There are no long-term data on the effect of everolimus on bone. Comparative data from BOLERO-2 showed marked improvement in serum bone-turnover markers during the first 12 weeks of therapy, suggesting a favorable effect on bone turnover.
Advanced neuroendocrine tumors of gastrointestinal, lung or pancreatic originRADIANT-3 (Study CRAD001C2324), a randomized, double-blind, multicenter phase III study of Afinitor plus best supportive care (BSC) versus placebo plus BSC in patients with advanced pancreatic neuroendocrine tumors (pNET), demonstrated a statistically significant clinical benefit of Afinitor over placebo by a 2.4-fold prolongation in median progression-free-survival PFS (see Table 2).
The primary endpoint for the trial was PFS evaluated by RECIST (Response Evaluation Criteria in Solid Tumors, version 1.0) as per investigator radiology review.
Secondary endpoints include safety, objective response rate ORR (complete response (CR) or partial response (PR)), response duration, and overall survival OS.
In total, 410 patients were randomized 1:1 to receive either Afinitor 10mg/day (n=207) or placebo (n=203). Demographics were well balanced (median age 58 years, 55% male, 78.5% Caucasian). Median duration of blinded study treatment was 37.8 weeks for patients receiving Afinitor and 16.1 weeks for those receiving placebo. (See Table 2.)
Click on icon to see table/diagram/image
Eighteen-months PFS rates were 34.2% for Afinitor therapy compared to 8.9% for placebo.
The objective response rate per investigator assessment was 4.8% for the everolimus arm vs. 2.0% for the placebo arm. Tumor reduction was also evident in 64.4% of patients in the everolimus arm versus 20.6% for placebo.
At the time of the final overall survival (OS) analysis, the median duration of OS was 44 months for the everolimus arm versus 37.7 months for the placebo arm, respectively [HR=0.94 (95% CI 0.73 to 1.20)]; p=0.300. Following disease progression, crossover to open-label Afinitor occurred in 172 of 203 patients (84.7%) randomized to placebo and may have confounded the detection of any treatment-related difference in overall survival.
RADIANT-4 (Study CRAD001T2302), a randomized, double-blind, multicenter phase III study of Afinitor plus best supportive care (BSC) versus placebo plus best supportive care was conducted in patients with advanced non-functional neuroendocrine tumors (NET) of gastrointestinal or lung origin without a history of and no active symptoms related to carcinoid syndrome.
The primary endpoint for the study was progression-free survival (PFS) evaluated by Response Evaluation Criteria in Solid Tumors (modified RECIST version 1.0), based on independent radiological assessment. Supportive PFS analysis was based on local investigator review.
Secondary endpoints included overall survival (OS), Overall Response Rate (ORR), Disease Control Rate (DCR = proportion of patients with a best overall response of complete response, partial response or stable disease), Safety, change in Quality of Life (QoL) via FACT-G and time to WHO PS deterioration.
A total of 302 patients were randomized in a 2:1 ratio to receive either everolimus (10 mg daily) (n=205) or placebo (n=97). The median age of patients was 63 years (range 22 to 86) and 76% were Caucasian. The median duration of blinded treatment was 40.4 weeks for patients receiving Afinitor and 19.6 weeks for those receiving placebo. Patients in the placebo arm did not cross-over to everolimus at the time of progression.
The efficacy results were obtained from the final analysis of PFS after 178 PFS events were observed per independent radiological review.
The study demonstrated a statistically significant clinical benefit of everolimus over placebo by a 2.8-fold prolongation in median PFS (see Table 3).
The analysis of PFS based on local investigator assessment was supportive and showed a 2.6-fold prolongation in median progression-free-survival (see Table 3).
Click on icon to see table/diagram/image
The overall PFS benefit favored Afinitor across predefined demographic and prognostic stratification subgroups (e.g., prior SSA treatment, tumor origin grouping and WHO performance status) and with a hazard ratio range of 0.43 to 0.63). A post-hoc subgroup analysis of PFS showed a positive PFS benefit for sites of tumor origin by gastrointestinal [HR=0.60 (95% CI: 0.39 to 0.91)], lung [HR=0.50 (95% CI: 0.28 to 0.88)] and carcinoma of unknown primary/other origin [HR=0.50 (95% CI: 0.22 to 1.16)].
The final overall survival (OS) analysis did not show statistically significant difference between those patients who received Afinitor or placebo during the blinded treatment period of the study [HR= 0.90 (95% CI: 0.66 to 1.24)].
The overall survival (OS) analysis is not yet mature. At the first interim analysis, 42 (20.5%) deaths were observed in the Afinitor arm vs. 28 (28.9%) deaths in the placebo arm; however, the results of this analysis did not meet the pre-specified stopping boundary for statistical significance [HR= 0.64 (95% CI: 0.40 to 1.05; p=0.037)].
Clinically or statistically significant differences were not observed between the two treatment arms in terms of time to deterioration of WHO PS (HR: 1.02; 95% CI: 0.65, 1.61) and time to deterioration of FACT-G total score (HR: 0.74; 95% CI: 0.50, 1.10).
RADIANT-2 (Study CRAD001C2325), a randomized, double-blind, multicenter phase III study of Afinitor plus depot octreotide (Sandostatin LAR) versus placebo plus depot octreotide in patients with advanced neuroendocrine tumors (carcinoid tumor) primarily of gastrointestinal or lung origin showed evidence of clinical benefit of Afinitor over placebo by a 5.1-month prolongation in median PFS (see Table 4). Although statistical significance was not reached for the primary analysis (boundary for statistical significance was p=0.0246), analyses which adjusted for informative censoring and imbalances in the two treatment arms showed a treatment effect in favor of everolimus.
RADIANT-2 enrolled patients with advanced neuroendocrine tumors (carcinoid tumor) primarily of gastrointestinal or lung origin whose disease had progressed within the prior 12 months and had a history of secretory symptoms. 80.1% of the patients in the Afinitor group received somatostatin analog therapy prior to study entry compared to 77.9% in the placebo group.
The primary endpoint is PFS evaluated by RECIST as per independent radiological review.
Secondary endpoints include safety, objective response, response duration, and overall survival.
In total, 429 patients were randomized 1:1 to receive either Afinitor 10 mg/day (n=216) or placebo (n=213), in addition to depot octreotide (Sandostatin LAR, administered intramuscularly) 30 mg every 28 days. Median duration of blinded study treatment was 37.0 weeks for patients receiving Afinitor and 36.6 weeks for those receiving placebo. Notable imbalances were evident for several important baseline prognostic factors, mainly in favor of the placebo group. (See Table 4.)
Click on icon to see table/diagram/image
Additional analyses for independent radiological review which adjusted for informative censoring and imbalances in the two treatment arms showed a treatment effect in favor of everolimus. Results of an additional adjusted multivariate analysis which corrected for imbalances between treatment arms yielded a HR of 0.73 (95% CI 0.56 to 0.97). The estimated HR (95% CI) from the IPCW analysis was 0.60 (0.44 to 0.84) in favor of Afinitor.
Eighteen-months PFS rates were 47.2% for everolimus therapy plus depot octreotide (Sandostatin LAR) compared with 37.4% for placebo plus depot octreotide (Sandostatin LAR).
The objective response rate per independent radiological review was 2.3% for the everolimus plus depot octreotide (Sandostatin LAR) arm vs. 1.9% for the placebo plus depot octreotide (Sandostatin LAR) arm. Tumor reduction was also evident in 75.0% of patients in the everolimus plus depot octreotide (Sandostatin LAR) arm versus 44.8% in the placebo plus depot octreotide (Sandostatin LAR) arm.
The final analysis of overall survival did not show a statistically significant difference in OS (HR=1.16; (95% CI: 0.91 to 1.49)). There were 133 (61.6%) deaths in the everolimus plus depot octreotide arm and 120 (56.3%) in the placebo plus depot octreotide arm. Crossover of >58% of patients from placebo to open-label Afinitor following disease progression, imbalance between treatment arms in subsequent use of octreotide and imbalance of key prognostic factors at baseline likely confounded the detection of any treatment-related difference in OS. When adjusted for important prognostic factors, the OS hazard ratio inclined towards unity (HR 1.06; 95% CI: 0.82, 1.36).
Advanced renal cell carcinoma: RECORD-1 (CRAD001C2240), a phase III, international, multicenter, randomized, double-blind study comparing Afinitor 10 mg/day and placebo, both in conjunction with best supportive care, was conducted in patients with metastatic renal cell carcinoma whose disease had progressed despite prior treatment with VEGFR-TKI (vascular endothelial growth factor receptor tyrosine kinase inhibitor) therapy (sunitinib, sorafenib, or both sunitinib and sorafenib). Prior therapy with bevacizumab and interferon-alpha was also permitted.
Progression-free survival, documented using RECIST (Response Evaluation Criteria in Solid Tumors) and assessed via a blinded, independent central review, was the primary endpoint. Secondary endpoints included safety, objective tumor response rate, overall survival, disease-related symptoms, and quality of life. The Independent Data Monitoring Committee recommended termination of this trial at the time of the second interim analysis as the primary endpoint had been met.
In total, 416 patients were randomized 2:1 to receive Afinitor (n=277) or placebo (n=139). Demographics were well balanced (pooled median age 61 years [range 27 to 85], 77% male, 88% Caucasian, 74% one prior VEGFR-TKI therapy). Median duration of blinded study treatment was 141 days for patients receiving Afinitor and 60 days for those receiving placebo.
Results from a planned interim analysis showed that Afinitor was superior to placebo for the primary endpoint of progression-free survival, with a statistically significant 67% reduction in the risk of progression or death (see Table 5).
Click on icon to see table/diagram/image
Six-month PFS rates were 36% for Afinitor therapy compared with 9% for placebo.
Confirmed objective tumor responses were observed in 5 patients (2%) receiving Afinitor while none were observed in patients receiving placebo. The progression-free survival advantage therefore primarily reflects the population with disease stabilization (corresponding to 67% of the Afinitor treatment group).
Final overall survival results yielded a trend in favor of Afinitor; the difference between treatment arms was not statistically significant (HR 0.90; 95% CI: 0.71 to 1.14; p=0.183). Crossover to open-label Afinitor following disease progression occurred in 111 of 139 patients (79.9%) allocated to placebo and may have confounded the detection of any treatment-related difference in overall survival. A strong trend is evident supporting better quality of life among patients receiving Afinitor as measured by disease-related symptoms (HR 0.75; 95% CI: 0.53 to 1.06; p=0.053).
Tuberous sclerosis complex (TSC) with refractory seizures: EXIST-3 (Study CRAD001M2304), a randomized, double-blind, multicenter, three-arm, parallel-group, phase-III study of Afinitor Dispersible Tablets versus placebo as adjunctive therapy was conducted in TSC patients with refractory seizures. Patients were treated with concomitant and stable dose of 1 to 3 antiepileptic drug(s) (AEDs) prior to study entry. The study consisted of three phases: an 8-week baseline observation phase; an 18-week double-blind, placebo-controlled core treatment phase (composed of titration and maintenance periods), an extension phase of ≥48 weeks in which all patients received everolimus and a post-extension phase of ≤48 weeks in which all patients received everolimus.
The study independently tested two different primary endpoints: 1) percentage reduction from baseline in seizure frequency during the maintenance period of the core phase; and 2) response rate defined as at least a 50% reduction from baseline in seizure frequency during the maintenance period of the core phase.
Secondary endpoints included seizure freedom, proportion of patients with >25% seizure frequency reduction from baseline, distribution of reduction from baseline in seizure frequency (≤-25%, >-25% to <25%; ≥25% to <50%; ≥50% to <75%; ≥75% to <100%; 100%), long-term evaluation of seizure frequency and overall quality-of-life.
A total of 366 TSC patients with refractory seizures were randomized in an 1:1.09:1 ratio to Afinitor (n=117) low trough (LT) range (3 to 7 ng/mL), Afinitor (n=130) high trough (HT) range (9 to 15 ng/mL) or placebo (n=119) added to each patient's concomitant AED therapy. Median age was 10.1 years (range: 2.2-56.3; 28.4% <6 years, 30.9% 6 to <12 years, 22.4% 12 to <18 years and 18.3% >18 years); 51.9% were male and 64.8% were Caucasian. Median duration of treatment was 18 weeks for all three arms in the core phase and 90 weeks when considering both the core and extension phases.
At baseline, 19.4% of patients had focal seizures with retained awareness (sensory with electroencephalogram (EEG) or motor), 45.1% had focal seizures with impaired awareness (predominantly non-motor), 69.1% had focal motor seizures, and 1.6% had generalized onset seizures (previously confirmed by EEG). The median baseline seizure frequency across the treatment arms was 35, 38, and 42 seizures per 28 days for the Afinitor LT, Afinitor HT, and placebo groups, respectively. The majority of patients (67%) failed 5 or more AEDs prior to the study and 41.0% and 47.8% of patients were taking 2 and ≥3 AEDs during the study. The baseline data indicated mild to moderate mental retardation in patients 6 to 18 years of age (scores of 60 to 70 on the Adaptive Behavior Composite and Communication, Daily Living Skills, and Socialization Domain Scores).
The study met its primary objectives both for seizure frequency response rate, as per EMA recommendation, and for the percentage reduction in seizure frequency, as per FDA recommendation, in the two everolimus trough + concomitant AEDs arms over the placebo + concomitant AEDs arm.
A consistent everolimus effect was observed across all subgroups evaluated for the primary efficacy endpoints by: age categories, gender, race and ethnicity, seizure types, seizures frequency at baseline, number and name of concomitant AEDs, and TSC features (angiomyolipoma, SEGA, cortical tuber status).
<Primary Endpoint #1> - Percentage reduction from baseline in seizure frequency (see Table 6).
Click on icon to see table/diagram/image
<Primary endpoint #2> Response rate defined as at least 50% reduction from baseline in seizure frequency (see Table 7).
Click on icon to see table/diagram/image
Results of both primary endpoints were consistent.
Based on modeling, a 2-fold increase in Time Normalized (TN)-C
min was associated with approximately a 2-fold increase in the odds for a seizure response (see PHARMACOLOGY: Pharmacodynamics: Exposure-response relationships as follows).
Cumulative percentage of patients with a reduction in seizure frequency (a change from baseline <0%) during the maintenance phase was consistently higher for the Afinitor LT and HT arms relative to the placebo arm.
The seizure free rate (proportion of patients who became seizure free during the maintenance period of the core phase) was 5.1% (95% CI: 1.9, 10.8) and 3.8% (95% CI: 1.3, 8.7) in the Afinitor LT and HT arms, respectively, versus 0.8% (95% CI: 0.0, 4.6) in the placebo arm.
The proportion of patients with at least 25% reduction in seizure frequency was 52.1% (95% CI: 42.7, 61.5) in the Afinitor LT and 70.0% (95% CI: 61.3, 77.7) in the Afinitor HT arms, respectively, versus 37.8% (95% CI: 29.1, 47.2) on placebo.
Higher proportions of responders were evident for all response categories (proportion of seizure frequency reduction from baseline [≤-25%, >-25% to <25%; ≥25% to <50%; ≥50% to <75%; ≥75% to <100%; 100%]), in the everolimus LT and HT arms relative to placebo. Furthermore, approximately twice as many patients in the placebo arm experienced seizure exacerbation relative to the everolimus LT and HT arms. (See Table 8.)
Click on icon to see table/diagram/image
At the end of the core phase, overall quality of life (as measured by the Quality Of Life total score in Childhood Epilepsy questionnaire (QOLCE), Quality Of Life In Epilepsy for Adolescents Questionnaire (QOLIE-AD-48) and Quality Of Life In Epilepsy questionnaire (QOLIE-31)) was maintained in each Afinitor treatment arm compared to the placebo arm.
Reduction in seizure frequency was sustained over an evaluation period of approximately 2 years. Based on a sensitivity analysis considering patients who prematurely discontinued everolimus as non-responders, response rates of 38.4% (95% CI: 33.4, 43.7) and 44.4% (95% CI:38.2, 50.7) were observed after 1 and 2 years of exposure to everolimus, respectively.
TSC with renal angiomyolipoma: EXIST-2 (Study CRAD001M2302), a randomized, double-blind, multicenter phase-III study of Afinitor versus placebo was conducted in patients with TSC who have angiomyolipoma (n=113) or sporadic LAM who have angiomyolipoma (n=5). Patients were randomized in a 2:1 ratio to receive either Afinitor Tablets or matching placebo. Presence of at least one angiomyolipoma ≥ 3 cm in longest diameter using CT/MRI (based on local radiology assessment) was required for entry.
The primary efficacy endpoint was angiomyolipoma response rate based on independent central radiology review. The analysis was stratified by use of enzyme-inducing antiepileptic drugs (EIAEDs) at randomization (yes/no).
Key secondary endpoints included time to angiomyolipoma progression and skin lesion response rate.
A total of 118 patients were randomized, 79 to Afinitor 10 mg daily and 39 to placebo. The two treatment arms were generally well balanced with respect to demographic and baseline disease characteristics and history of prior anti-angiomyolipoma therapies. Median age was 31 years (range: 18 to 61; 46.6% were <30 years at enrolment), 33.9% were male, and 89.0% were Caucasian. Of the enrolled patients, 83.1% had angiomyolipomas ≥ 4 cm (with 28.8% with angiomyolipomas ≥ 8 cm), 78.0% had bilateral angiomyolipomas, and 39.0% had undergone prior renal embolization/nephrectomy; 96.6% had skin lesions at baseline and 44.1% had target SEGAs (at least one SEGA ≥ 1 cm in longest diameter).
The median duration of blinded study treatment was 48.1 weeks (range 2 to 115) for patients receiving Afinitor and 45.0 weeks (range 9 to 115) for those receiving placebo.
Results showed that Afinitor was superior to placebo for the primary endpoint of best overall angiomyolipoma response (p<0.0001) (see Table 9).
Patients initially treated with placebo were allowed to cross over to everolimus at the time of angiomyolipoma progression and upon recognition that treatment with everolimus was superior to treatment with placebo. At the time of the final analysis (4 years following the last patient randomization), the median duration of exposure to everolimus was 204.1 weeks (range 2 to 278).
Among patients treated with everolimus during the study, no cases of angiomyolipoma-related nephrectomy and only one case of renal embolization were reported. (See Table 9.)
Click on icon to see table/diagram/image
Reduction in angiomyolipoma volume was evident in 95.5% of patients in the Afinitor arm versus 59.4% in the placebo arm at primary analysis.
In the final analysis, reduction in angiomyolipoma volume improved with longer term treatment with Afinitor. At weeks 12, 96 and 192, ≥30% reductions in volume were observed in 75.0% (78/104), 80.6% (79/98) and 85.2% (52/61) of the treated patients, respectively. Similarly, at the same timepoints, ≥50% reductions in volume were observed in 44.2% (46/104), 63.3% (62/98) and 68.9% (42/61) of the treated patients, respectively.
Afinitor was associated with a clinically relevant and statistically significant prolongation in time to angiomyolipoma progression (HR 0.08; 95% CI: 0.02, 0.37; p<0.0001) at the primary analysis. Median time to angiomyolipoma progression was 11.4 months in the placebo arm and was not reached in the Afinitor arm. Progressions were observed in 3.8% (3/79) of patients in the Afinitor arm compared with 20.5% (8/39) in the placebo arm. Estimated progression-free rates at 6 months were 98.4% for the Afinitor arm and 83.4% for the placebo arm. At the final analysis, median time to angiomyolipoma progression was not reached. Angiomyolipoma progressions were observed in 14.3% of the patients (16/112). The estimated angiomyolipoma progression-free rates at 24 months and 48 months were 91.6% (95% CI: 84.0%, 95.7%) and 83.1% (95% CI: 73.4%, 89.5%) respectively.
At the primary analysis, Afinitor demonstrated clinically meaningful and statistically significant improvements in skin lesion response (p=0.0002), with response rates of 26.0% (20/77) (95% CI: 16.6, 37.2) for the Afinitor arm and 0% (0/37) (95% CI: 0.0, 9.5) for the placebo arm. At the final analysis, the skin lesion response rate had increased to 68.2% (73/107) (95% CI: 58.5%, 76.9%), with one patient reporting a confirmed complete clinical skin lesion response and no patients experiencing progressive disease as their best response.
In an exploratory analysis of patients with TSC with angiomyolipoma who also had SEGA, the SEGA response rate (proportion of patients with ≥50% reduction from baseline in target lesion volumes in the absence of progression) was 10.3% (4/39) in the everolimus arm at the primary analysis (versus no responses reported in the 13 patients randomized to placebo with a SEGA lesion at baseline) and increased to 48.0% (24/50) at the final analysis.
year after discontinuation of everolimus, experienced an increase in tumor volume compared to their most recent tumor volume assessment performed before treatment discontinuation; though the angiomyolipoma volume did not exceed that measured at baseline. Two of 16evaluable patients developed protocol-defined angiomyolipoma progression by virtue of angiomyolipoma-related bleeding (n=1) and increase in kidney volume (n=1). These findings suggest that persistence of clinically significant angiomyolipoma volume reduction requires ongoing treatment in most patients.
TSC with SEGA: Phase III trial in patients with TSC who have SEGA: EXIST-1 (Study CRAD001M2301), a randomized, double-blind, multicenter phase-III study of Afinitor versus placebo was conducted in patients with TSC who have SEGA, irrespective of age. Patients were randomized in a 2:1 ratio to receive either Afinitor or matching placebo. Presence of at least one SEGA lesion ≥ 1.0 cm in longest diameter using MRI (based on local radiology assessment) was required for entry. In addition, serial radiological evidence of SEGA growth, presence of a new SEGA lesion ≥ 1 cm in longest diameter, or new or worsening hydrocephalus was required for entry.
The primary efficacy endpoint was SEGA response rate based on independent central radiology review. The analysis was stratified by use of enzyme-inducing antiepileptic drugs (EIAEDs) at randomization (yes/no).
Key secondary endpoints in hierarchal order of testing included the absolute change in frequency of total seizure events per 24-hour EEG from baseline to Week 24, time to SEGA progression, and skin lesion response rate. Angiomyolipoma response rate was evaluated as an exploratory analysis.
A total of 117 patients were randomized, 78 to Afinitor and 39 to placebo. The two treatment arms were generally well balanced with respect to demographic and baseline disease characteristics and history of prior anti-SEGA therapies. Median age was 9.5 years (range: 0.8 to 26.6; 69.2% were 3 to < 18 years at enrolment; 17.1% were < 3 years at enrolment), 57.3% were male, and 93.2% were Caucasian. The median duration of blinded study treatment was 52.2 weeks (range 24 to 89) for patients receiving Afinitor and 46.6 weeks (range 14 to 88) for those receiving placebo.
Results showed that Afinitor was superior to placebo for the primary endpoint of best overall SEGA response (p<0.0001) (see Table 10).
At the time of final analysis, the median duration of exposure to everolimus among all such patients was 204.9 weeks (range 8.1 to 253.7). The best overall SEGA response rate had increased to 57.7% (95% CI: 47.9, 67.0) at the final analysis.
No patient required surgical intervention for SEGA during the entire course of the study. (See Table 10.)
Click on icon to see table/diagram/image
Consistent treatment effects were observed across all subgroups (eg., EIAED use vs. EIAED non-use, sex, age (<3, 3 to <18, and ≥18 years), evaluated at the primary efficacy analysis, ranging from 23% to 52% responders in the Afinitor arm versus 0% responders in the placebo arm.
During the double-blind period, reduction of SEGA volume was evident within the initial 12 weeks of treatment with Afinitor: 29.7% (22/74) of patients had ≥50% reductions in volume and 73.0% (54/74) of patients had ≥ 30% reductions in volume. Sustained reductions were evident at Week 24, 41.9% (31/74) of patients had ≥50% reductions and 78.4% (58/74) of patients had ≥ 30% reductions in SEGA volume.
In the everolimus treated population (N=111) of the study, including patients who crossed over from the placebo group, tumor response, starting as early as after 12 weeks on everolimus, was sustained at later time points. The proportion of patients achieving at least 50% reductions in SEGA volume was 45.9% (45/98) and 62.1% (41/66) at Weeks 96 and 192 after start of everolimus treatment. Similarly, the proportion of patients achieving at least 30% reductions in SEGA volume was 71.4% (70/98) and 77.3% (51/66) at Weeks 96 and 192 after start of everolimus treatment.
Analysis of the first key secondary endpoint, change in seizure frequency, was inconclusive.
Median time to SEGA progression based on central radiology review was not reached in either treatment arm. Progressions were only observed in the placebo arm (15.4%; unadjusted p=0.0002). Estimated progression-free rates at 6 months were 100% for the Afinitor arm and 85.7% for the placebo arm. The long-term follow up of patients randomized to everolimus and patients randomized to placebo who thereafter crossed over to everolimus demonstrated durable responses.
Additional clinical benefits of Afinitor were observed such as reductions in severity of skin lesions and size of renal angiomyolipoma.
At the time of the primary analysis, Afinitor demonstrated clinically meaningful improvements in skin lesion response (unadjusted p=0.0004), with response rates of 41.7% (95% CI: 30.2, 53.9) for the Afinitor arm and 10.5% (95% CI: 2.9, 24.8) for the placebo arm. At the final analysis, the skin lesion response rate increased to 58.1% (95% CI: 48.1, 67.7).
At the time of the primary analysis, angiomyolipoma responses were only observed in the everolimus arm (n/N:16/30; 53.3%; 95% CI: 34.3, 71.7). At the time of final analysis, among the 41 TSC-SEGA patients with an angiomyolipoma lesion(s) present at start of treatment with everolimus, 30 patients (73.2%; 95% CI: 57.1, 85.8) achieved, as their best overall response, at least a 50% reduction in sum of angiomyolipoma volumes. Among the 37 patients with evaluable angiomyolipoma tumor assessments, 35 patients (94.6%) experienced a reduction in the sum of target angiomyolipoma volumes relative to baseline as their best percentage change. Over the entire duration of the study, no new angiomyolipoma lesions were observed, nor were instances of grade 2 or worse bleeding episodes reported.
Pharmacokinetics: Absorption: After administration of Afinitor Tablets in patients with advanced solid tumors, peak everolimus concentrations are reached 1 to 2 hours after administration of an oral dose of 5 to 70 mg everolimus under fasting conditions or with a light fat-free snack. C
max is dose-proportional with daily dosing between 5 and 10 mg. With single doses of 20 mg and higher, the increase in C
max is less than dose-proportional, however AUC shows dose-proportionality over the 5 to 70 mg dose range.
Food effect: In healthy subjects, high fat meals reduced systemic exposure to 10 mg Afinitor Tablets (as measured by AUC) by 22% and the peak blood concentration C
max by 54%. Low-fat meals reduced AUC by 32% and C
max by 42%.
Distribution: The blood-to-plasma ratio of everolimus, which is concentration-dependent over the range of 5 to 5,000 ng/mL, is 17% to 73%. The amount of everolimus confined to the plasma is approximately 20% at blood concentrations observed in cancer patients given Afinitor 10 mg/day. Plasma protein binding is approximately 74% both in healthy subjects and in patients with moderate hepatic impairment.
Following intravenous administration in a rat model, everolimus was shown to cross the blood-brain barrier in a non-linear dose-dependent manner, suggesting saturation of an efflux pump at the blood-brain barrier. Brain penetration of everolimus has also been demonstrated in rats receiving oral doses of everolimus.
Biotransformation/Metabolism: Everolimus is a substrate of CYP3A4 and PgP. Following oral administration, it is the main circulating component in human blood. Six main metabolites of everolimus have been detected in human blood, including three monohydroxylated metabolites, two hydrolytic ring-opened products, and a phosphatidylcholine conjugate of everolimus. These metabolites were also identified in animal species used in toxicity studies, and showed approximately 100-times less activity than everolimus itself. Hence, the parent substance is considered to contribute the majority of the overall pharmacological activity of everolimus.
Elimination: No specific excretion studies have been undertaken in cancer patients; however, data are available from the transplantation setting. Following the administration of a single dose of radiolabelled everolimus in conjunction with ciclosporin, 80% of the radioactivity was recovered from the faeces, while 5% was excreted in the urine. The parent substance was not detected in urine or faeces.
Steady-state pharmacokinetics: After administration of Afinitor Tablets in patients with advanced solid tumors, steady-state AUC
0-τ was dose-proportional over the range of 5 to 10 mg with a daily dosing regimen. Steady-state was achieved within two weeks. C
max is dose-proportional between 5 and 10 mg daily. T
max occurs at 1 to 2 hours post-dose. There was a significant correlation between AUC
0-τ and pre-dose trough concentration at steady-state on a daily regimen. The mean elimination half-life of everolimus is approximately 30 hours.
Special populations: Hepatic impairment: The safety, tolerability and pharmacokinetics of Afinitor were evaluated in two single oral dose studies of Afinitor Tablets in subjects with impaired hepatic function relative to subjects with normal hepatic function. In one study the average AUC of everolimus in 8 subjects with moderate hepatic impairment (Child-Pugh class B) was twice that found in 8 subjects with normal hepatic function. In a second study of 34 subjects with different impaired hepatic function compared to normal subjects, there was a 1.6-fold, 3.3-fold, and 3.6-fold increase in exposure (i.e. AUC
(0-inf)) for subjects with mild (Child-Pugh A), moderate (Child-Pugh B), and severe (Child-Pugh C) hepatic impairment, respectively. Simulations of multiple dose pharmacokinetics support the dosing recommendations in hepatic impaired subjects based on their Child Pugh status.
Based on a meta-analysis of the two studies, dose adjustment is recommended for patients with hepatic impairment (see PRECAUTIONS and DOSAGE & ADMINISTRATION).
Renal impairment: In a population pharmacokinetic analysis of 170 patients with advanced cancer, no significant influence of creatinine clearance (25 to 178 mL/min) was detected on CL/F of everolimus. Post-transplant renal impairment (creatinine clearance range 11 to 107 mL/min) did not affect the pharmacokinetics of everolimus in transplant patients.
Pediatric patients (below 18 years): There is no indication for use of Afinitor in the pediatric cancer population (see DOSAGE & ADMINISTRATION) or in pediatric patients with TSC who have renal angiomyolipoma.
In patients with TSC who have SEGA receiving Afinitor Tablets, everolimus C
min was approximately dose-proportional within the dose range from 1.35 mg/m
2 to 14.4 mg/m
2.
In patients with TSC who have SEGA receiving Afinitor Tablets, the everolimus geometric mean C
min values normalized to mg/m
2 dose in patients aged <10 years and 10-18 years were statistically lower than those observed in adults (>18 years of age), suggesting that everolimus clearance was higher in younger patients.
Geriatric patients (65 years of age or older)
: In a population pharmacokinetic evaluation in cancer patients, no significant influence of age (27 to 85 years) on oral clearance (CL/F: range 4.8 to 54.5 litres/hour) of everolimus was detected.
Race/Ethnicity: Oral clearance (CL/F) is similar in Japanese and Caucasian cancer patients with similar liver functions.
Based on analysis of population pharmacokinetics, oral clearance (CL/F) is on average 20% higher in black transplant patients.
Toxicology: Non-Clinical Safety Data: The preclinical safety profile of everolimus was assessed in mice, rats, minipigs, monkeys and rabbits. The major target organs were male and female reproductive systems (testicular tubular degeneration, reduced sperm content in epididymides and uterine atrophy) in several species; lungs (increased alveolar macrophages) in rats and mice; and eyes (lenticular anterior suture line opacities) in rats only. Minor kidney changes were seen in the rat (exacerbation of age-related lipofuscin in tubular epithelium, increases in hydronephrosis) and mouse (exacerbation of background lesions). There was no indication of kidney toxicity in monkeys or minipigs.
Everolimus appeared to spontaneously exacerbate background diseases (chronic myocarditis in rats, coxsackie virus infection of plasma and heart in monkeys, coccidian infestation of the gastrointestinal tract in minipigs, skin lesions in mice and monkeys). These findings were generally observed at systemic exposure levels within the range of therapeutic exposure or above, with the exception of the findings in rats, which occurred below therapeutic exposure due to a high tissue distribution.
In juvenile rat toxicity studies at doses as low as 0.15 mg/kg/day, systemic toxicity included decreased body weight gain and food consumption, and delayed attainment of some developmental landmarks at all doses, with full or partial recovery after cessation of dosing. With the possible exception of the rat-specific lens finding, where young animals appeared to be more susceptible, it appears that there is no significant difference in the sensitivity of juvenile animals to the adverse effects of everolimus as compared to adult animals at doses of 0.5 to 5 mg/kg per day. No relevant toxicity was evident in juvenile monkeys at doses up to 0.5 mg/kg/day for 4-weeks.
Genotoxicity studies covering relevant genotoxicity endpoints showed no evidence of clastogenic or mutagenic activity. Administration of everolimus for up to 2 years did not indicate any oncogenic potential in mice and rats up to the highest doses, corresponding respectively to 3.9 and 0.2 times the estimated clinical exposure from a 10 mg daily dose.
Reproductive toxicity: For information on reproductive toxicity, see USE IN PREGNANCY & LACTATION.


 Click on icon to see table/diagram/image
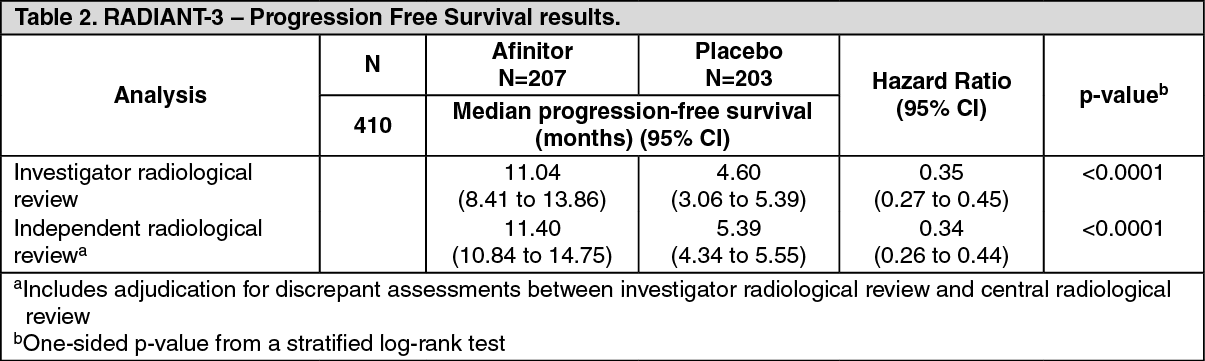 Click on icon to see table/diagram/image
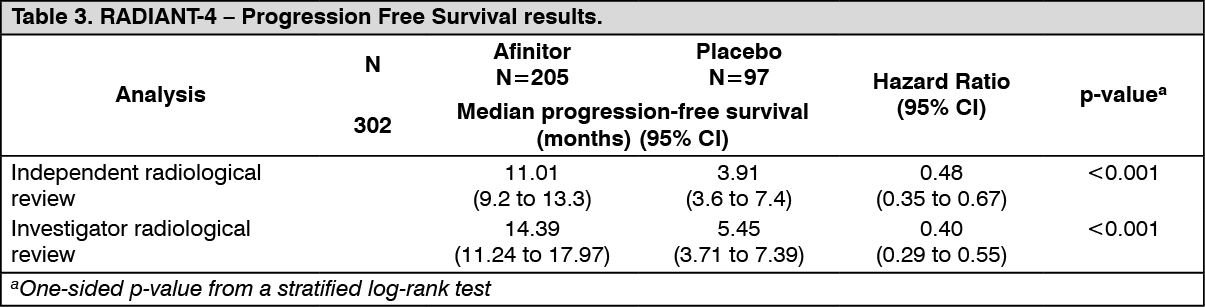 Click on icon to see table/diagram/image
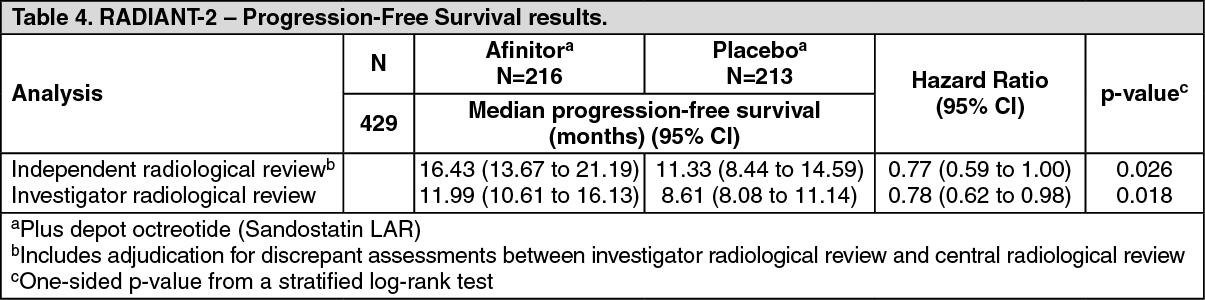 Click on icon to see table/diagram/image
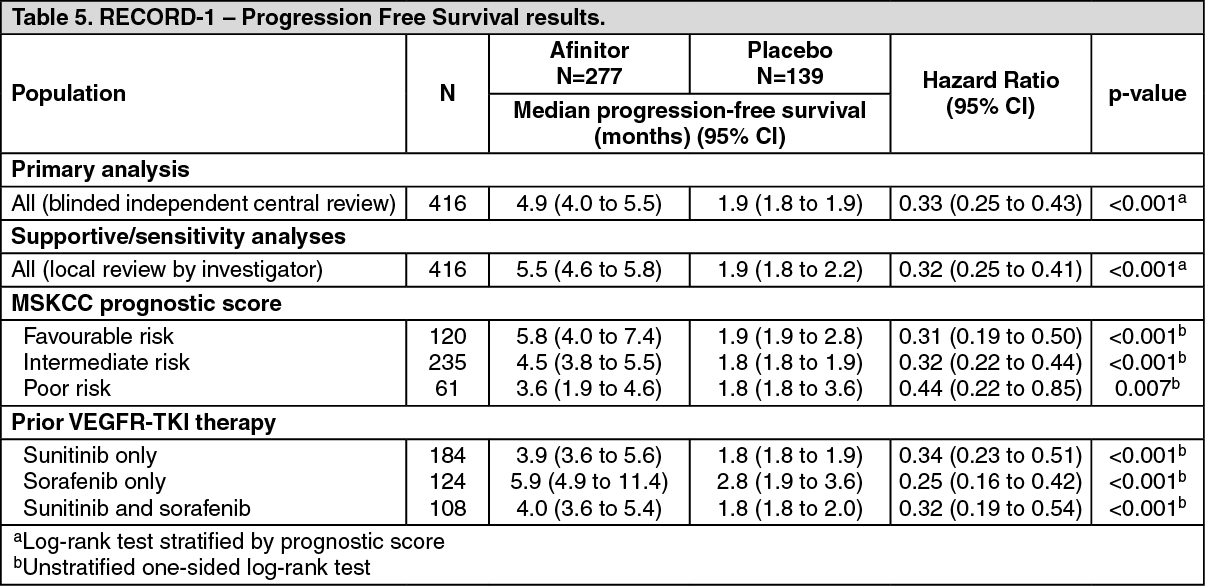 Click on icon to see table/diagram/image
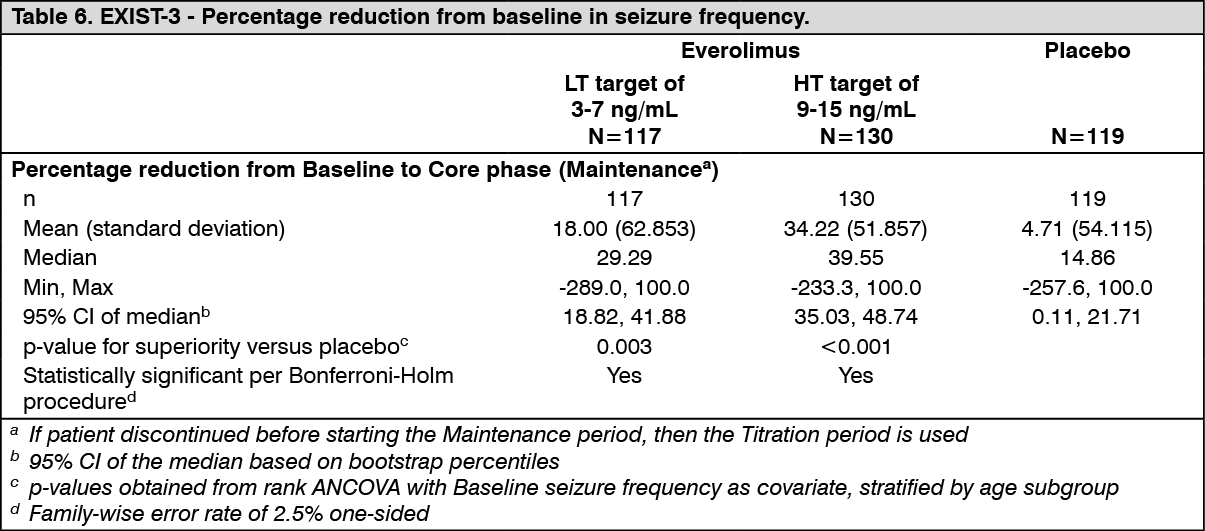 Click on icon to see table/diagram/image
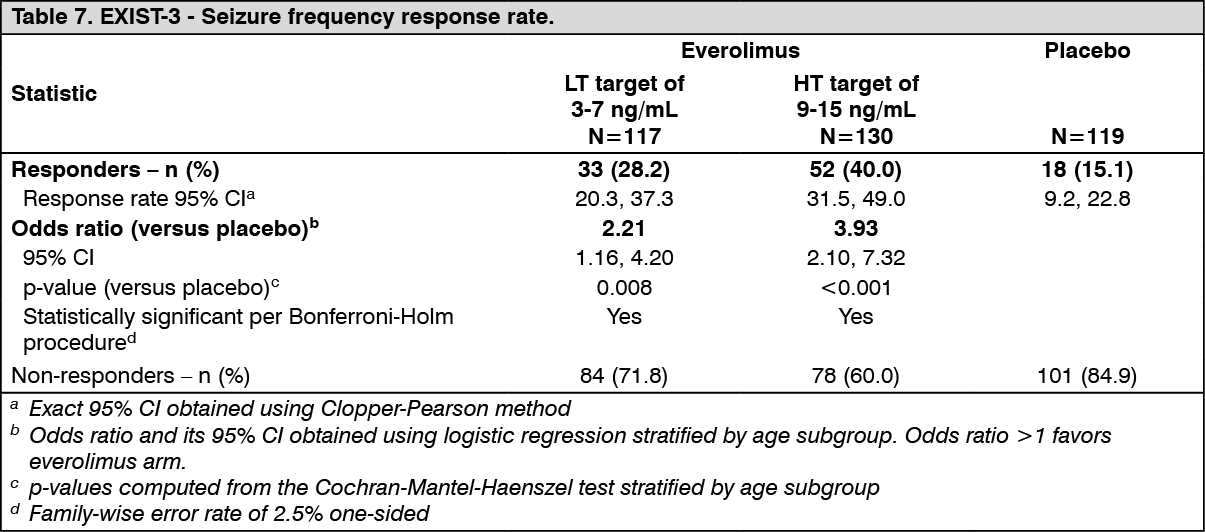 Click on icon to see table/diagram/image
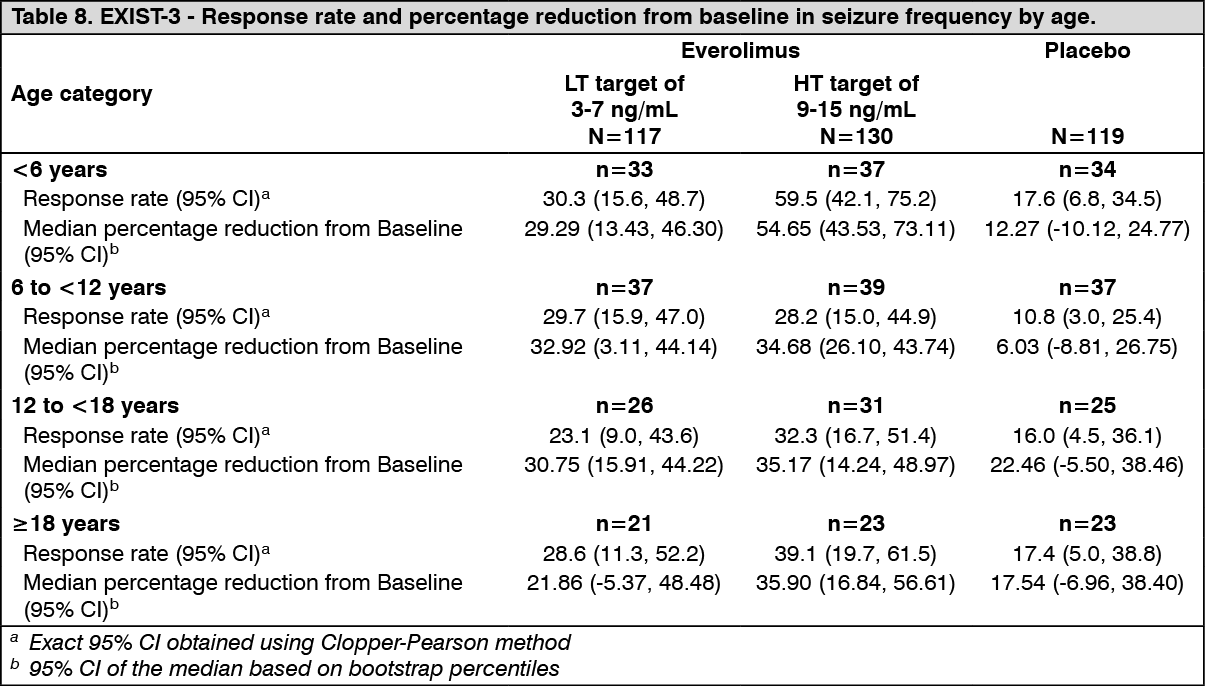 Click on icon to see table/diagram/image
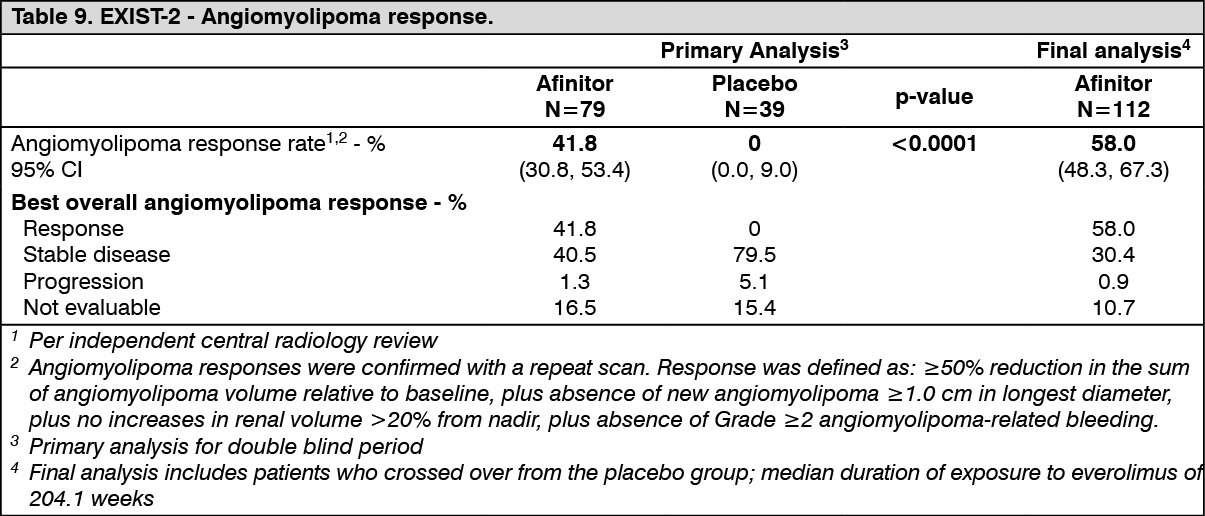 Click on icon to see table/diagram/image
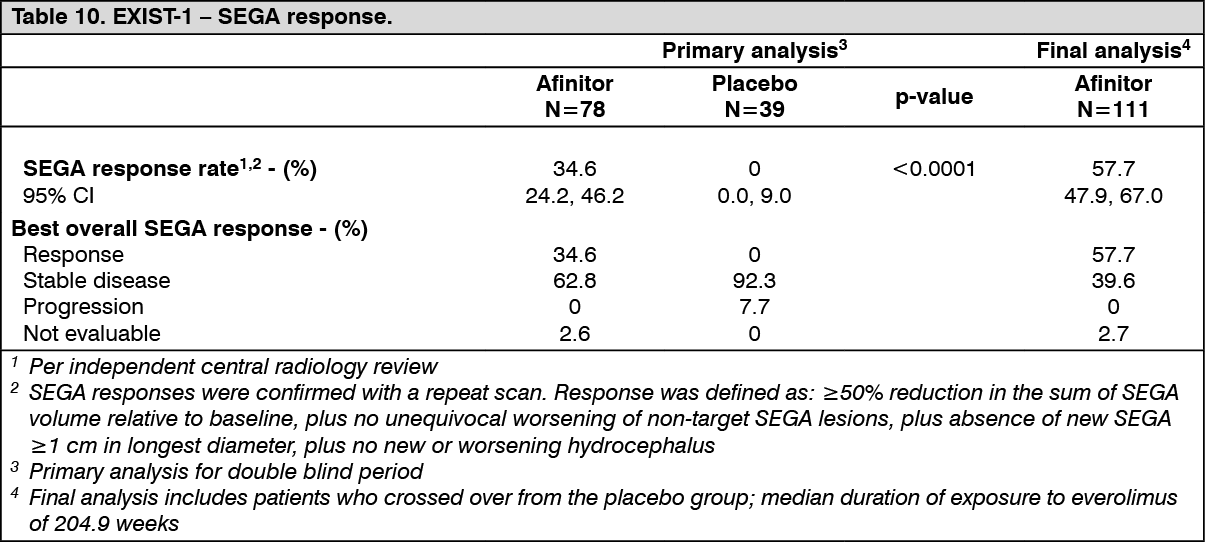 Click on icon to see table/diagram/image
 Click on icon to see table/diagram/image
 Click on icon to see table/diagram/image
 Click on icon to see table/diagram/image
 Click on icon to see table/diagram/image
 Click on icon to see table/diagram/image
 Click on icon to see table/diagram/image

 Sign Out
