


 Sign Out

At the molecular level, everolimus forms a complex with the cytoplasmic protein FKBP-12. In the presence of everolimus the growth factor-stimulated phosphorylation of the p70 S6 kinase is inhibited. Since p70 S6 kinase phosphorylation is under the control of FRAP (also called m-TOR), this finding suggests that the everolimus-FKBP-12 complex binds to and thus interferes with the function of FRAP. FRAP is a key regulatory protein which governs cell metabolism, growth and proliferation; disabling FRAP function thus explains the cell cycle arrest caused by everolimus.
Everolimus thus has a different mode of action than ciclosporin. In preclinical models of allotransplantation, the combination of everolimus and ciclosporin was more effective than either compound alone.
The effect of everolimus is not restricted to T cells. Everolimus generally inhibits growth-factor-stimulated proliferation of hematopoietic cells and non-hematopoietic cells such as vascular smooth muscle cells. Growth-factor-stimulated proliferation of vascular smooth muscle cells, triggered by injury to endothelial cells and leading to neointima formation, plays a key role in the pathogenesis of chronic rejection. Preclinical studies with everolimus have shown inhibition of neointima formation in a rat aorta allotransplantation model.
Clinical Studies: Renal transplantation: Everolimus (Certican) in fixed doses of 1.5 mg/day and 3 mg/day, in combination with standard doses of ciclosporin for microemulsion and corticosteroids was investigated in two phase III de novo renal transplant trials (B201 and B251). Mycofenolate mofetil (MMF) 1 g b.i.d. was used as comparator. The co-primary composite endpoints were efficacy failure (biopsy-proven acute rejection, graft loss, death or loss to follow-up) at 6 months and graft loss, death or loss to follow-up at 12 months. Everolimus (Certican) was, overall, non-inferior to MMF in these trials. In the B201 study, the incidence of biopsy-proven acute rejection at 6 months in the everolimus (Certican) 1.5 mg/day, everolimus (Certican) 3 mg/day and MMF groups was 21.6%, 18.2%, and 23.5%, respectively. In the B251 study, the incidence for the everolimus (Certican) 1.5 mg/day, everolimus (Certican) 3 mg/day and MMF groups was 17.1%, 20.1%, and 23.5%, respectively.
Reduced allograft function with elevated serum creatinine was observed more frequently among subjects using everolimus (Certican) in combination with full dose ciclosporin for microemulsion than in MMF patients. This effect suggests that everolimus (Certican) increases ciclosporin nephrotoxicity. Drug concentration-pharmacodynamic analysis showed that renal function could be improved with reduced exposure to ciclosporin while conserving efficacy for as long as blood trough everolimus concentration was maintained above 3 ng/mL. This concept was subsequently confirmed in two further Phase III studies (A2306 and A2307, including 237 and 256 patients respectively) which evaluated the efficacy and safety of everolimus (Certican) 1.5 and 3 mg everolimus (Certican) per day (initial dosing; subsequent dosing based on target trough concentration (C0) ≥3 ng/mL) in combination with reduced exposure to ciclosporin. In both studies, renal function was improved without compromising efficacy. In these studies however there was no non-everolimus comparative arm.
A phase III, multicenter, randomized, open-label, controlled trial A2309, has been completed in which 833 de-novo renal transplant recipients were randomized to either one of two everolimus (Certican) regimens, differing by dosage, and combined with reduced-dose ciclosporin or a standard regimen of sodium mycophenolate (MPA) + ciclosporin and treated for 12 months. All patients received induction therapy with basiliximab pre-transplant and on Day 4 post-transplant. Steroids could be given as required post-transplant.
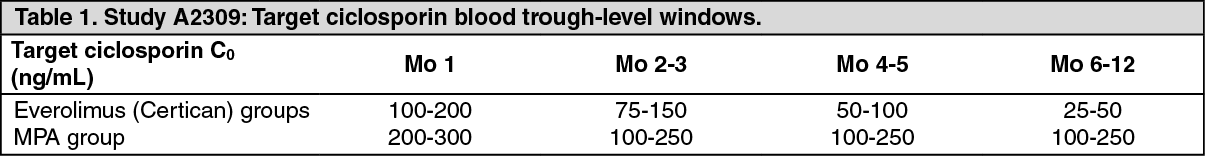
Starting dosages in the two everolimus (Certican) groups were 1.5 mg/d and 3 mg, given b.i.d., subsequently modified from Day 5 onwards to maintain target blood trough everolimus levels of 3 to 8 ng/mL and 6 to 12 ng/mL respectively. Sodium mycophenolate dosage was 1.44 g/d. Ciclosporin dosages were adapted to maintain target blood trough-level windows as shown in Table 1. The actual measured values for blood concentrations of everolimus and ciclosporin (Co and C2) are shown in Table 2.
Although the higher dosage everolimus (Certican) regimen was as effective as the lower-dosage regimen, the overall safety was worse and so the upper-dosage regimen is not recommended.
The lower dosage regimen for everolimus (Certican) is that recommended (see Dosage & Administration). (See Table 1 and Table 2.)
 Click on icon to see table/diagram/image
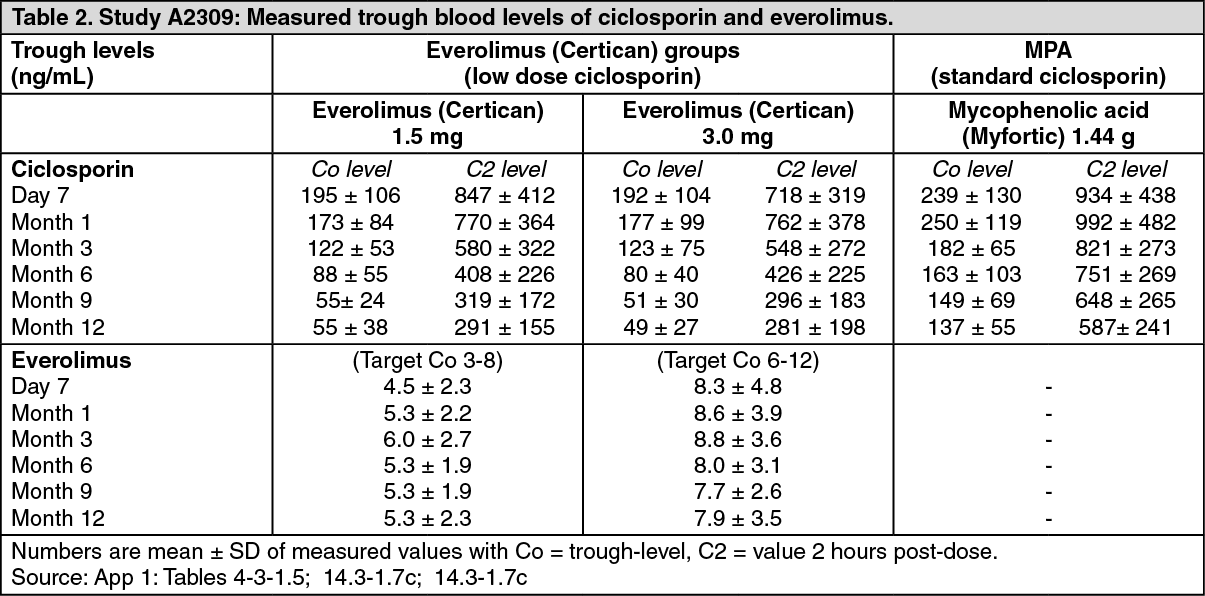 Click on icon to see table/diagram/image
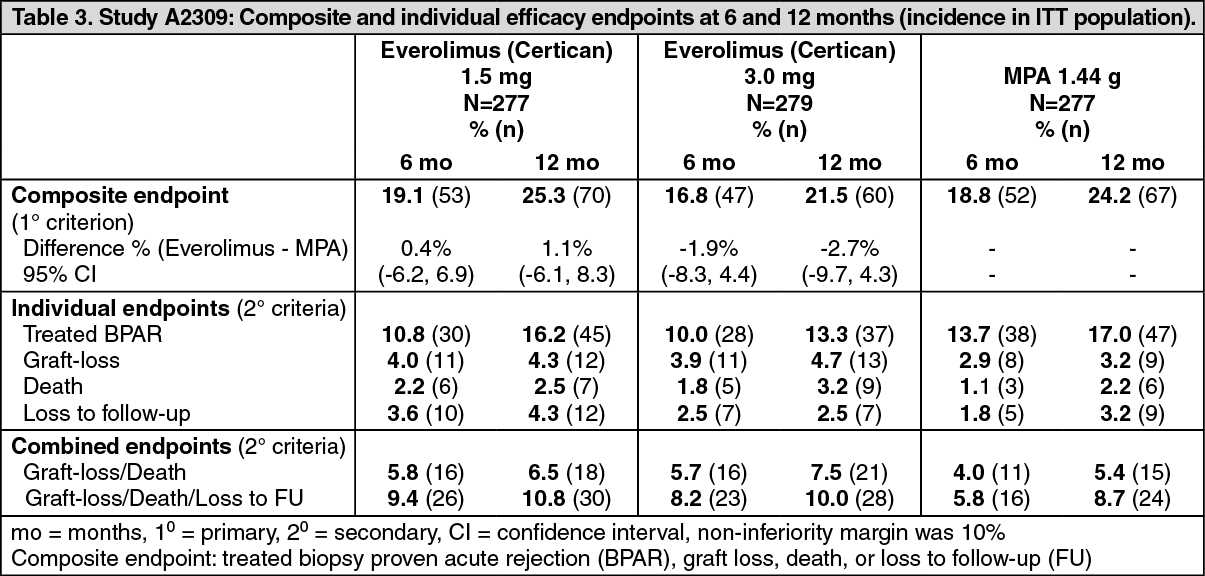
The primary efficacy endpoint was a composite failure variable (biopsy-proven acute rejection, graft loss, death or loss to follow-up). The outcome is shown in Table 3. (See Table 3.)
 Click on icon to see table/diagram/image
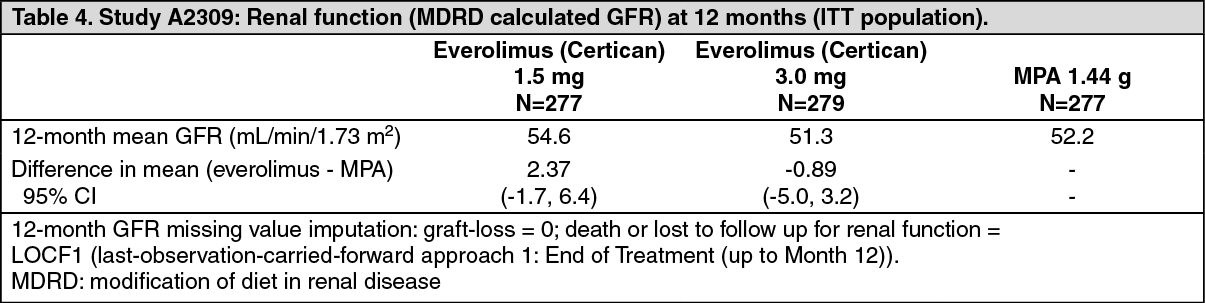
Changes in renal function, as shown by calculated glomerular filtration rate (GFR) using the MDRD formula are shown in Table 4.
Proteinuria was assessed at scheduled visits by spot analysis of urinary protein/creatinine and categorized by levels of clinical relevance as represented in Table 5. Few patients in any of the treatment groups reached the nephrotic threshold but a greater proportion of everolimus (Certican) patients was consistently in the sub-nephrotic category than was the case in the MPA group. A concentration effect was shown relating proteinuria levels to everolimus trough levels particularly at values of Cmin above 8 ng/mL.
Adverse drug reactions reported with everolimus (Certican) regimen have been included previously (Table 16). A lower frequency for viral infection was reported for everolimus-treated patients resulting principally from lower reporting rates for CMV infection (0.7% versus 5.95%) and BK virus infection (1.5% versus 4.8%). (See Table 4 and Table 5.)
 Click on icon to see table/diagram/image
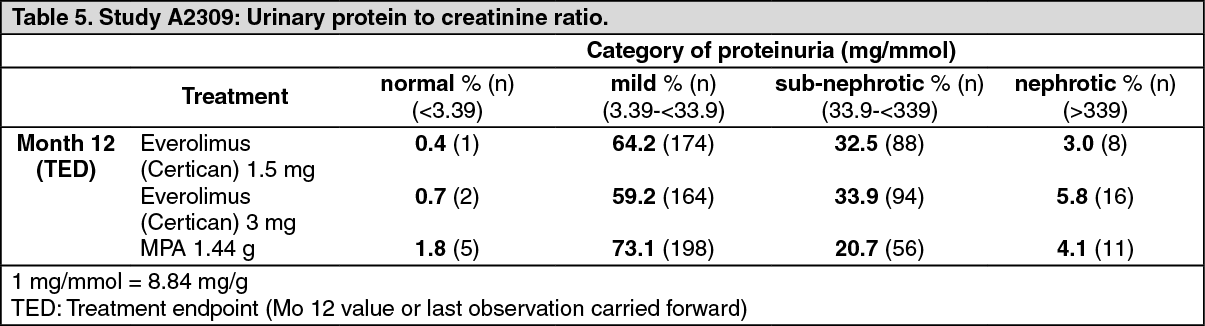 Click on icon to see table/diagram/image
Cardiac transplantation: In the phase III cardiac study (B253), everolimus (Certican) 1.5 mg/day and 3 mg/day, in combination with standard doses of ciclosporin for microemulsion and corticosteroids, were both compared with azathioprine (AZA) 1-3 mg/kg/day. The primary endpoint was a composite of the incidence of the following acute rejection ≥ ISHLT grade 3A, acute rejection associated with hemodynamic compromise, graft loss, patient death or loss to follow-up at 6, 12 and 24 months. The incidence of biopsy proven acute rejection ≥ ISHLT grade 3A at month 6 was 27.8% for the 1.5 mg/day group, 19% for the 3 mg/day group and 41.6% for the AZA group respectively (p = 0.003 for 1.5 mg vs control, < 0.001 for 3 mg vs control).
Based on coronary artery intravascular ultrasound data obtained from a subset of the study population, both everolimus (Certican) doses were statistically significantly more effective than AZA in preventing allograft vasculopathy (defined as an increase in maximum intimal thickness from baseline ≥ 0.5 mm in at least one matched slice of an automated pullback sequence), an important risk factor for long term graft loss.
Elevated serum creatinine was observed more frequently among subjects using everolimus (Certican) in combination with full dose of ciclosporin for microemulsion than in AZA patients. These results indicated that everolimus (Certican) increases the ciclosporin-induced nephrotoxicity. However, further analysis suggested that renal function could be improved with ciclosporin dose-reduction without loss of efficacy as long as everolimus blood values are maintained above a given threshold. Studies A2411 and A2310 have subsequently been carried out to investigate this.
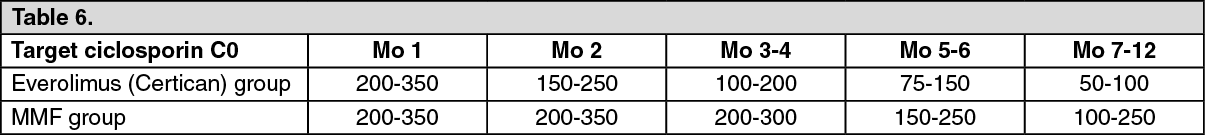
Study A2411 was a randomized, 12 months, open-label study comparing everolimus (Certican) in combination with reduced doses of ciclosporin microemulsion and corticosteroids to mycophenolic mofetil (MMF) and standard doses of ciclosporin microemulsion and corticosteroids in de novo cardiac transplant patients. The study included a total of 174 patients. Everolimus (Certican) (N=92) was initiated at 1.5 mg/day and the dose was adjusted to maintain target blood everolimus trough levels between 3 to 8 ng/mL. MMF (N=84) was initiated at a dosage of 1,500 mg bid. Ciclosporin microemulsion doses were adjusted to target the following trough levels (ng/mL): See Table 6.
 Click on icon to see table/diagram/image
Renal function was improved with the reduced ciclosporin dosage regimen with mean creatinine clearance (Cockcroft-Gault formula) at 6 months: Everolimus (Certican): 65.4 v. MMF: 72.2 mL/mn, and at 12 months: Everolimus (Certican): 68.7 v. MMF: 71.8 mL/mn. Efficacy, expressed as the rate of biopsy-proven acute rejection episodes (ISHLT grade ≥3A), was maintained as comparable in the two groups at 12 months (Everolimus (Certican): 22.8% v. MMF: 29.8%).
Study A2310 is a phase III, multicenter, randomized, open-label study comparing the efficacy and safety of two everolimus (Certican)/reduced-dose ciclosporin regimens against a standard mycophenolate mofetil (MMF)/ciclosporin regimen over 24 months. The use of induction therapy was center-specific, the options being no-induction or induction with either basiliximab or thymoglobulin. All patients received corticosteroids.
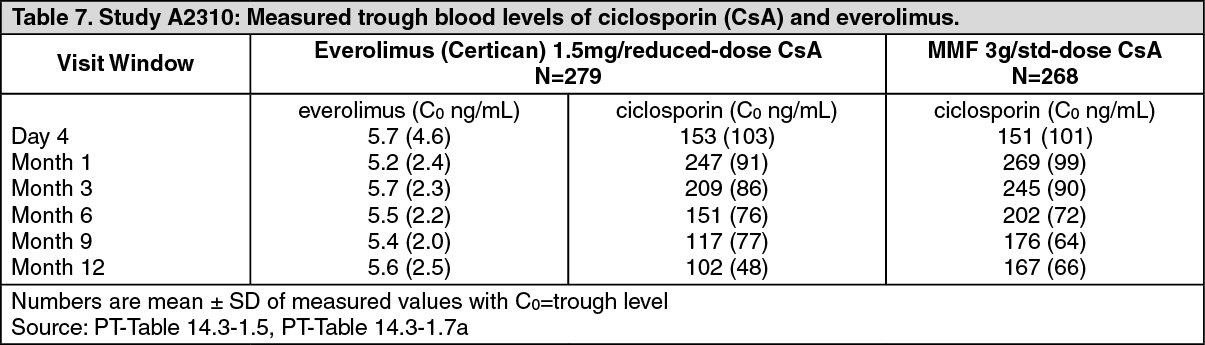
Starting doses in the two everolimus (Certican) groups were 1.5 mg/day and 3 mg/day, subsequently modified from Day 4 onwards to maintain target blood trough everolimus levels of 3 to 8 ng/ml and 6 to 12 ng/ml respectively. The MMF dose was 3 g/day. Ciclosporin dosages were adapted to maintain the same target blood trough level windows as in study A2411. Blood concentrations of everolimus and ciclosporin are shown in Table 7.
Recruitment to the experimental, upper-dosage everolimus (Certican) treatment arm was prematurely discontinued because of an increased rate of fatalities within this treatment group, due to infection and cardiovascular disorders, occurring within the first 90 days post-randomization. The nature and pattern of the fatalities in this dosage arm did not suggest the difference to be linked to the presence or type of induction therapy.
Statistical comparisons are limited to comparisons between the completed treatment arms. The drug blood concentration levels actually achieved are described in Table 7. (See Table 7.)
 Click on icon to see table/diagram/image
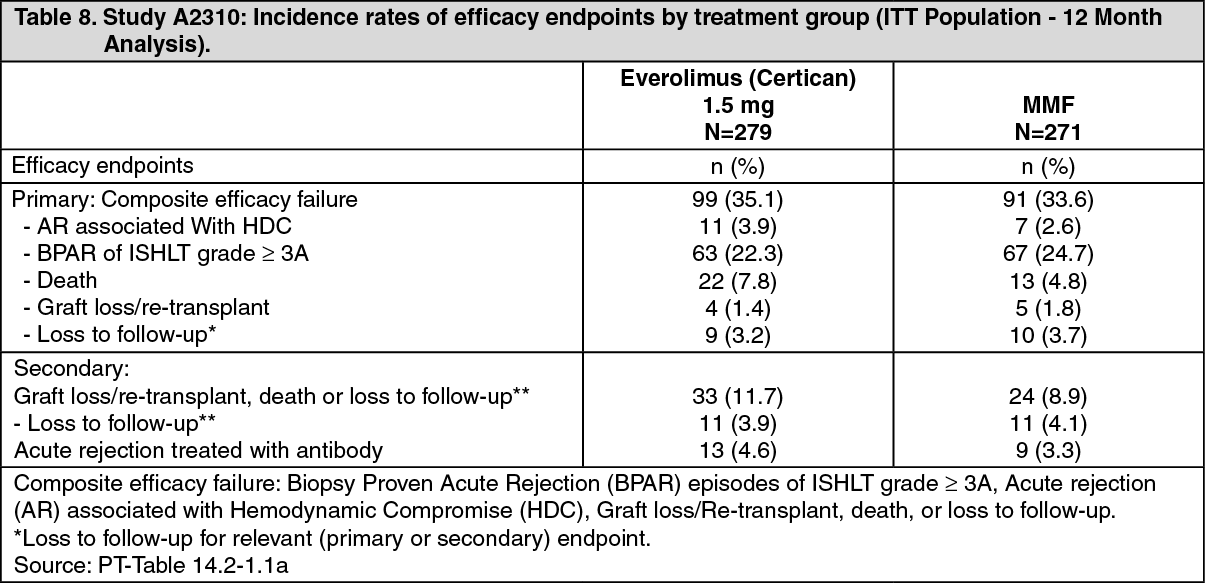
The primary efficacy endpoint was a composite failure variable, implying occurrence of any of the following: Biopsy Proven Acute Rejection (BPAR) episode of ISHLT grade ≥3A, acute rejection (AR) episode associated with hemodynamic compromise (HDC), graft loss/re-transplant, death, or loss to follow-up. Efficacy outcome at 12 months is shown in Table 8. (See Table 8.)
 Click on icon to see table/diagram/image
The higher fatality rate in the everolimus (Certican) arm relative to the MMF arm was mainly the result of an increased rate of fatalities from infection in the first three months among everolimus (Certican) patients in the study sub-group of patients receiving thymoglobulin induction therapy. A notably higher 3-month incidence in severe infections in everolimus (Certican) than MMF patients in the thymoglobulin subgroup appears to reflect greater immunosuppressive potency. The imbalance in fatalities within the thymoglobulin subgroup being particularly evident among patients hospitalized prior to transplantation and with L-ventricular assistance devices, suggests greater vulnerability in such patients to the consequences of infectious complications.
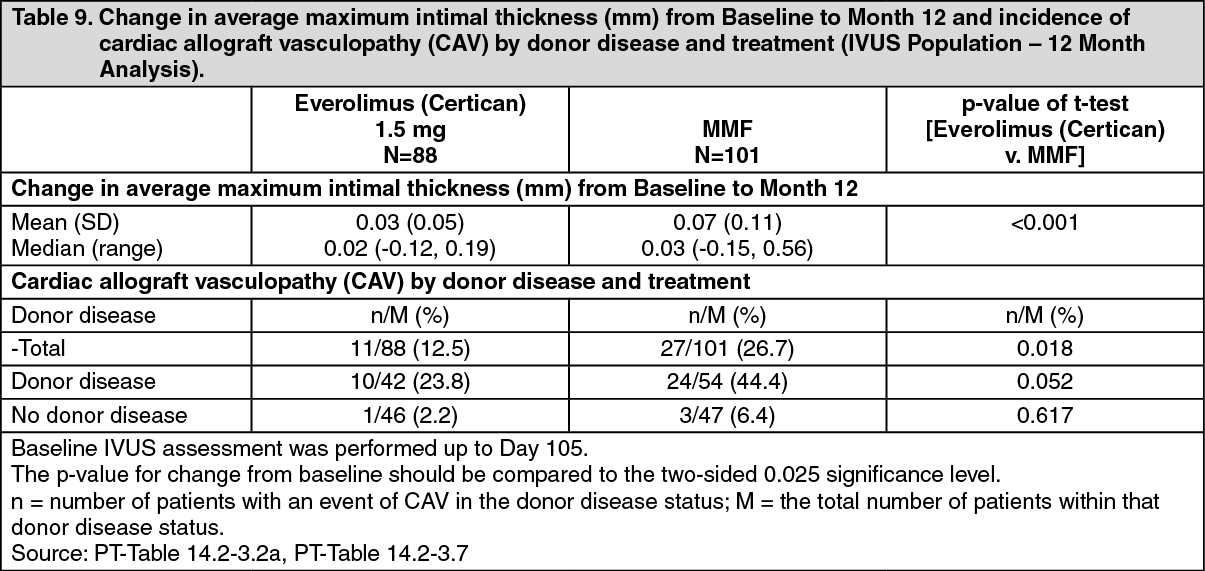
Intravascular ultrasound (IVUS) studies were performed on a subset of patients to investigate changes post-transplantation (Month 12 value relative to a baseline value effected during the first three months post-transplant) in intimal thickness within a segment of the left anterior descending (LAD) coronary artery. The results of the measured change in maximum intimal thickness along with frequency of patients with cardiac allograft vasculopathy (defined as an increase in the maximal intimal thickness of 0.5mm or more) are described in Table 9. (See Table 9.)
 Click on icon to see table/diagram/image
The reduced increase in intimal coronary thickness in everolimus (Certican) relative to MMF patients was apparent regardless of age, gender, presence or absence of diabetes and maximum level of serum cholesterol observed by Month 12.
Renal function over the course of study A2310, assessed by calculated glomerular filtration rate (GFR) using the MDRD formula, indicates a statistically significant difference of 5.5 mL/min/1.73m2 (97.5% CI -10.9, -0.2) lower for the everolimus 1.5 mg group at Month 12.
Data suggest that the difference observed was mainly associated with the exposure to ciclosporin. This difference was reduced to 3.6 mL/min/1.73m2 and not statistically significant (97.5% CI -8.9, 1.8) in centers where the mean ciclosporin levels were lower in patients receiving everolimus (Certican) than in patients randomized to the control arm, as recommended.
Additionally, the difference was mainly driven by a difference developed during the first month post-transplantation when patients are still in an unstable hemodynamic situation possibly confounding the analysis of renal function. Thereafter, the decrease in mean GFR from Month 1 to Month 12 was significantly smaller in the everolimus group than in the control group (-6.4 vs -13.7 mL/min, p=0.002).
Proteinuria, expressed as urinary protein:urinary creatinine levels measured in spot urine samples tended to be more elevated in the everolimus-treated patients. Sub-nephrotic values were observed in 22% of the patients receiving everolimus (Certican) compared to MMF patients (8.6%). Nephrotic levels were also reported (0.8%), representing 2 patients in each treatment group.
The adverse reactions for everolimus 1.5 mg group in Study A2310 are consistent with adverse drug reactions presented in Table 16. A lower rate of viral infections was reported for everolimus-treated patients resulting principally from a lower reporting rate for CMV infection compared to MMF (7.2% vs 19.4%).
Hepatic transplantation: In the phase III adult hepatic transplant study (H2304), reduced exposure tacrolimus and everolimus (Certican) 1.0 mg b.i.d. was administered to HCV+ and HCV- patients with the initial everolimus (Certican) dose starting approximately 4 weeks after transplantation and was investigated vs. standard exposure tacrolimus up to 24 months (core study) and for an additional 12 month extension period up to 36 months post-transplant. Everolimus (Certican) was dose adjusted to maintain target blood everolimus trough levels between 3 to 8 ng/mL for the everolimus (Certican) + reduced tacrolimus arm. Mean everolimus trough levels were within the target ranges at all time points ranging from 3.4 to 6.3 ng/mL in the everolimus (Certican) + reduced tacrolimus arm. Tacrolimus doses were subsequently adjusted to achieve target trough levels between 3 to 5 ng/mL through 12 months in the everolimus (Certican) + reduced tacrolimus arm.
The primary endpoint of the study was to compare the efficacy failure rate, defined as the composite endpoint of treated biopsy proven acute rejection, graft loss or death with early tacrolimus minimization, facilitated by introduction of everolimus (Certican) starting approximately 4 weeks after liver transplantation, to standard exposure tacrolimus, at 12 months.
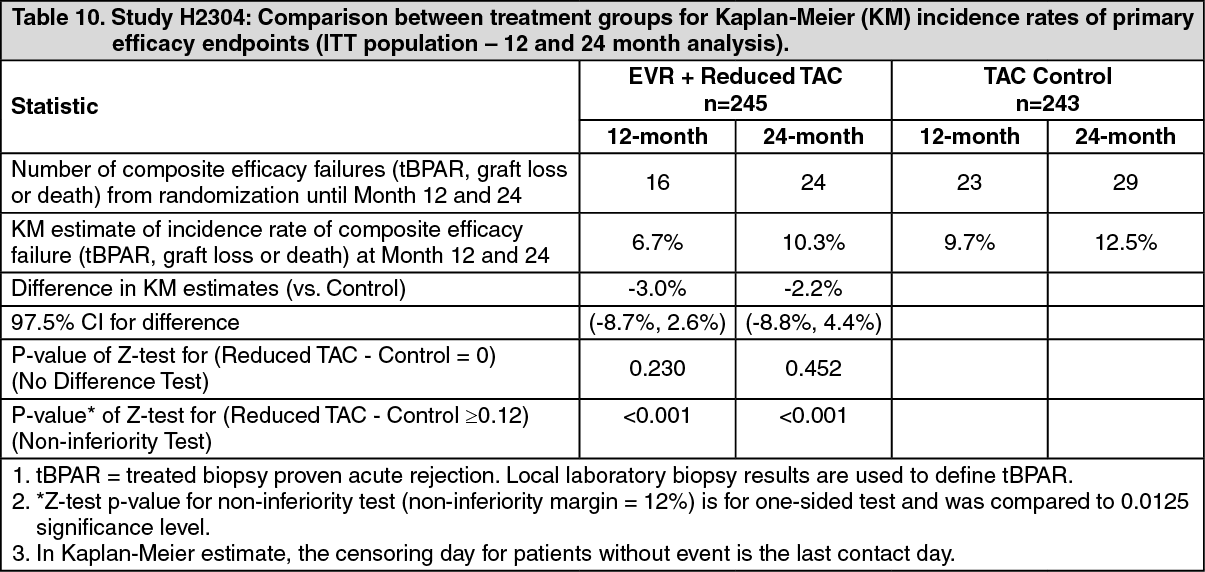
Overall, in the 12 month analysis, the incidence of the composite endpoint (tBPAR, graft loss or death) was lower in everolimus (Certican) + reduced tacrolimus arm (6.7%) compared to the tacrolimus control arm (9.7%) (Table 10). The difference in estimates between everolimus (Certican) + reduced tacrolimus and tacrolimus control was - 3.0% with 97.5% CI: (-8.7% to 2.6%). Regarding the rates of graft loss and fatal cases the everolimus (Certican) + reduced tacrolimus arm was non-inferior compared to the tacrolimus control arm indicating no increased mortality risk in this population. A statistically significantly lower rate of acute rejection was seen in the everolimus (Certican) + reduced tacrolimus arm (3.7%) compared to tacrolimus control arm (10.7%) (Table 11). Results are similar between HCV+ and HCV- patients. (See Tables 10 and 11.)
 Click on icon to see table/diagram/image
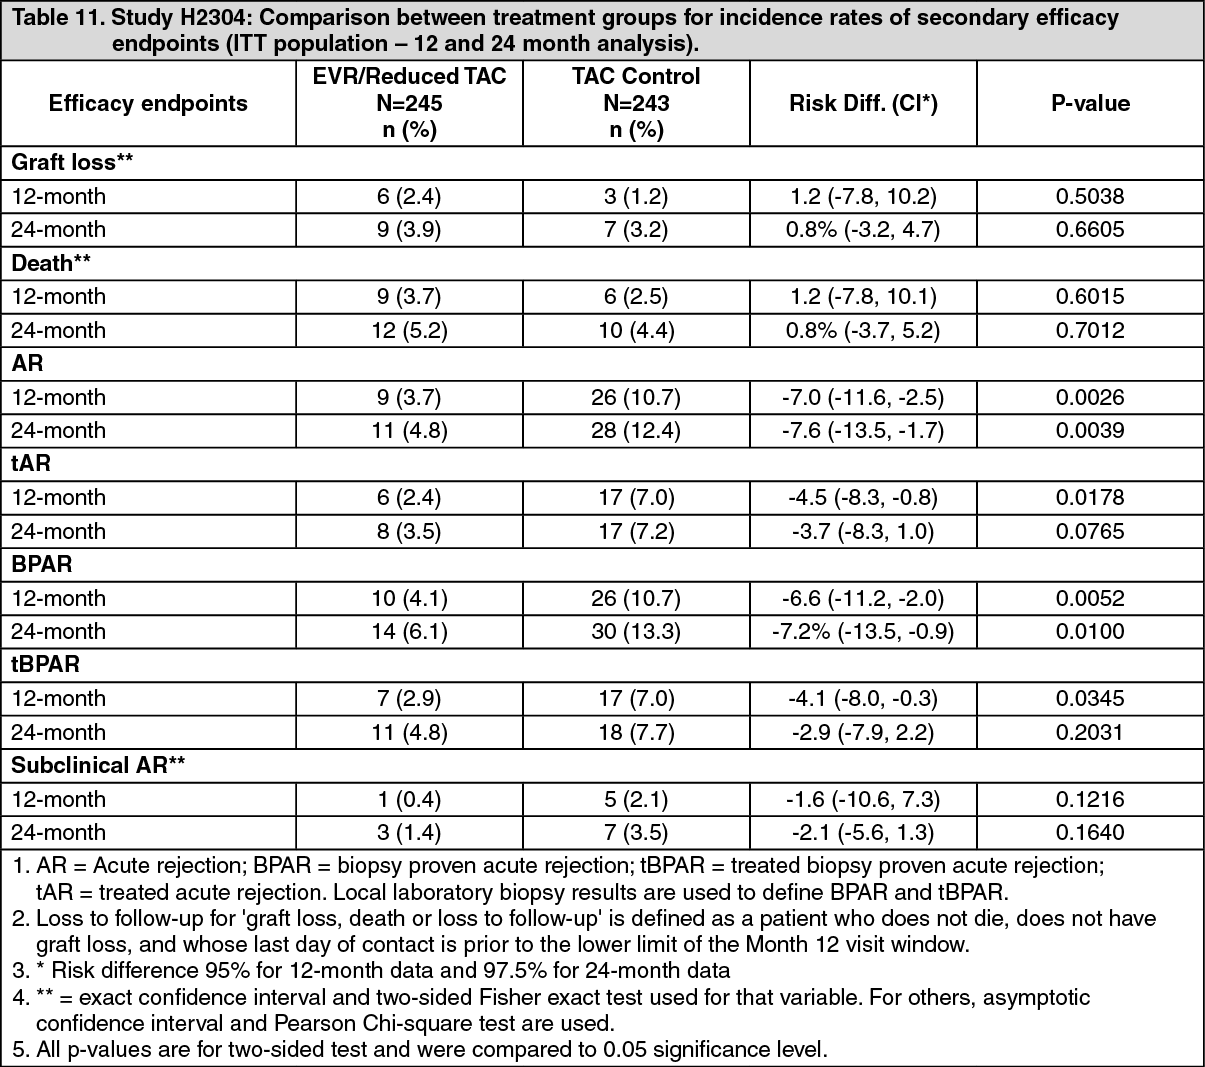 Click on icon to see table/diagram/image
Extension - primary efficacy results at 36 months: Of the total 231 patients who entered the extension for everolimus (Certican) + reduced tacrolimus (n=106) and tacrolimus control (n=125), 84% and 86% of patients completed study medication, 91% and 94% of patients completed study phase with 16% and 14% of patients discontinuing study medication, respectively.
The incidence of patients with composite efficacy failure events (tBPAR, graft loss or death) at Month 36 since extension baseline (Month 24) was low and similar across the treatment arms at 1.9% (n=2), and 2.4% (n=3) in the everolimus (Certican) + reduced tacrolimus and tacrolimus control arms respectively.
For the ITT population (all patients randomized in the core study), the Kaplan-Meier estimates of the primary composite efficacy endpoint (tBPAR, graft loss or death) to 36 months was lower in the everolimus (Certican) + reduced tacrolimus arm (11.5%) than in the tacrolimus control arm (14.6%). The difference between everolimus (Certican) + reduced tacrolimus and tacrolimus control was -3.2% (97.5% CI: −10.5%, 4.2%; p-value 0.3337).
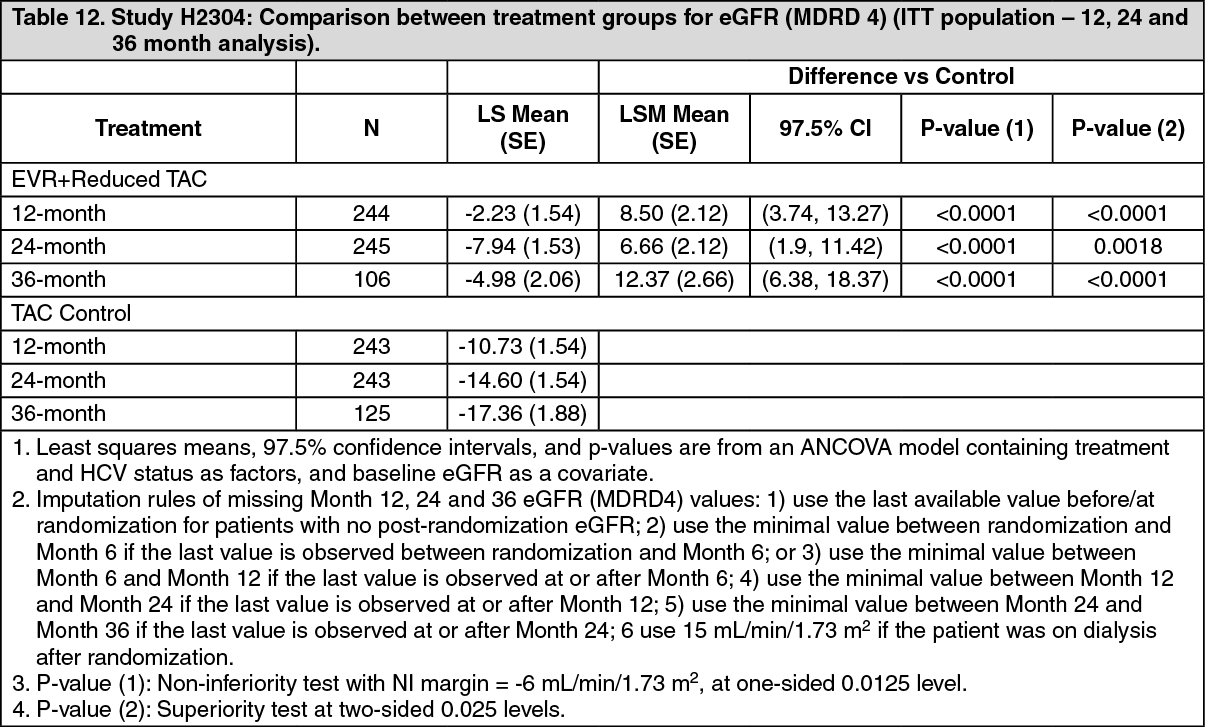
Renal function: Comparison between treatment groups for change in eGFR (MDRD4) [mL/min/1.73 m2] from time of randomization (day 30) to Months 12, 24 and 36 for the ITT population is presented in Table 12.
The eGFR at 12 months was higher for everolimus (Certican) + reduced tacrolimus (80.6 mL/min/1.73 m2) in comparison to the tacrolimus control (70.3 mL/min/1.73m2) and a higher eGFR was also observed throughout the entire study. (See Table 12.)
 Click on icon to see table/diagram/image
Statistically significant between-treatment group difference (everolimus (Certican) + reduced tacrolimus vs. tacrolimus control arm) was observed in favor of everolimus (Certican) + reduced tacrolimus arm for the mean eGFR from Week 6 up to Month 36 (including at study endpoint and treatment endpoint). At randomization, mean eGFR was 85.0 and 78.0 mL/min/1.73m2 for the everolimus (Certican) + reduced tacrolimus and tacrolimus control arms respectively. At the Month 36 time point, the difference in mean eGFR between everolimus (Certican) + reduced tacrolimus and tacrolimus control was 15.2 mL/min/1.73m2. The mean eGFR at Month 36 was 78.7 and 63.5 mL/min/1.73m2 for the everolimus (Certican) + reduced tacrolimus and tacrolimus control arms respectively.
Pharmacokinetics: Absorption: Peak everolimus concentrations are reached 1 to 2 hours after administration of an oral dose. Everolimus blood concentrations in transplant patients are dose-proportional-over the dose range of 0.25 to 15 mg. The relative bioavailability of the dispersible tablet compared with the conventional tablet is 0.90 (90% CI 0.76 to 1.07) based on the AUC-ratio.
Food effect: the Cmax and AUC of everolimus are reduced by 60% and 16%, respectively, when the tablet formulation is given with a high-fat meal. To minimize variability, everolimus (Certican) should either be consistently taken with food, or consistently taken without it.
Distribution: The blood-to-plasma ratio of everolimus, which is concentration-dependent over the range of 5 to 5000 ng/mL, is 17% to 73%. Plasma protein binding is approximately 74% in healthy subjects and patients with moderate hepatic impairment. The distribution volume associated with the terminal phase (Vz/F) in maintenance renal transplant patients is 342 ± 107 L.
Biotransformation/metabolism: Everolimus is a substrate of CYP3A4 and P-glycoprotein. Following oral administration, it is the main circulating component in human blood. Six main metabolites of everolimus have been detected in human blood, including three monohydroxylated metabolites, two hydrolytic ring-opened products, and a phosphatidylcholine conjugate of everolimus. These metabolites were also identified in animal species used in toxicity studies, and showed approximately 100-times less activity than everolimus itself. Hence, the parent substance is considered to contribute the majority of the overall pharmacological activity of everolimus.
Pediatric patients (below 18 years): Everolimus CL/F increased in a linear manner with patient age (1 to 16 years), body surface area (0.49 to 1.92 m2), and weight (11 to 77 kg). Steady-state CL/F was 10.2 ± 3.0 L/h/m2 and elimination half-life was 30 ± 11 h. Nineteen pediatric de novo renal transplant patients (1 to 16 years) received everolimus (Certican) dispersible tablets at a dose of 0.8 mg/m2 (maximum 1.5 mg) twice daily with ciclosporin for microemulsion. They achieved an everolimus AUC of 87 ± 27 ng•h/mL which is similar to adults receiving 750 mcg twice daily. Steady-state trough levels (C0) were 4.4 ± 1.7 ng/mL.
Geriatric patients (65 years or above): A limited reduction in everolimus oral CL of 0.33% per year was estimated in adults (age range studied was 16 to 70 years). No dose adjustment is considered necessary.
Race/Ethnicity: Based on analysis of population pharmacokinetics, oral clearance (CL/F) is, on average, 20% higher in black transplant patients (see Dosage & Administration).
Excretion: After a single dose of radiolabelled everolimus in transplant patients receiving ciclosporin, most of the radioactivity (80%) was recovered from the feces, and only a minor amount (5%) was excreted in urine. Parent drug was not detected in the urine or feces.
Steady-state pharmacokinetics: The pharmacokinetics were comparable in kidney and heart transplant patients receiving everolimus twice daily with ciclosporin for microemulsion. Steady state is reached by day 4, with a 2 to 3-fold accumulation in blood levels as compared with exposure after the first dose. Tmax occurs at 1 to 2 h postdose. At 750 mcg and 1.5 mg b.i.d., Cmax averages 11.1 ± 4.6 and 20.3 ± 8.0 ng/mL, respectively, and AUC averages 75 ± 31 and 131 ± 59 ng•h/mL, respectively. At 750 mcg and 1.5 mg b.i.d., predose trough blood levels (Cmin) average 4.1 ± 2.1 and 7.1 ± 4.6 ng/mL, respectively. Everolimus exposure remains stable over time in the first post-transplant year. Cmin is significantly correlated with AUC, yielding a correlation coefficient between 0.86 and 0.94. Based on analysis of population pharmacokinetics oral clearance (CL/F) is 8.8 L/h (27% interpatient variation) and the central distribution volume (Vc/F) is 110 L (36% interpatient variation). Residual variability in blood concentrations is 31%. The elimination half-life is 28 ± 7 h.
Renal impairment: Post-transplant renal impairment (Clcrea range, 11 to 107 mL/min) did not affect the pharmacokinetics of everolimus.
Hepatic impairment: Relative to the AUC of everolimus in subjects with normal hepatic function, the average AUC in 6 patients with mild hepatic impairment (Child-Pugh Class A) was 1.6-fold higher; in two independently studied groups of 8 and 9 patients with moderate hepatic impairment (Child-Pugh Class B) the average AUC was 2.1-fold and 3.3-fold higher; and in 6 patients with severe hepatic impairment (Child-Pugh Class C) the average AUC was 3.6-fold higher. Mean half-lives were 52, 59, and 78 hours in mild, moderate, and severe hepatic impairment. The prolonged half-lives delay the time to reach steady-state everolimus blood levels (see Dosage & Administration).
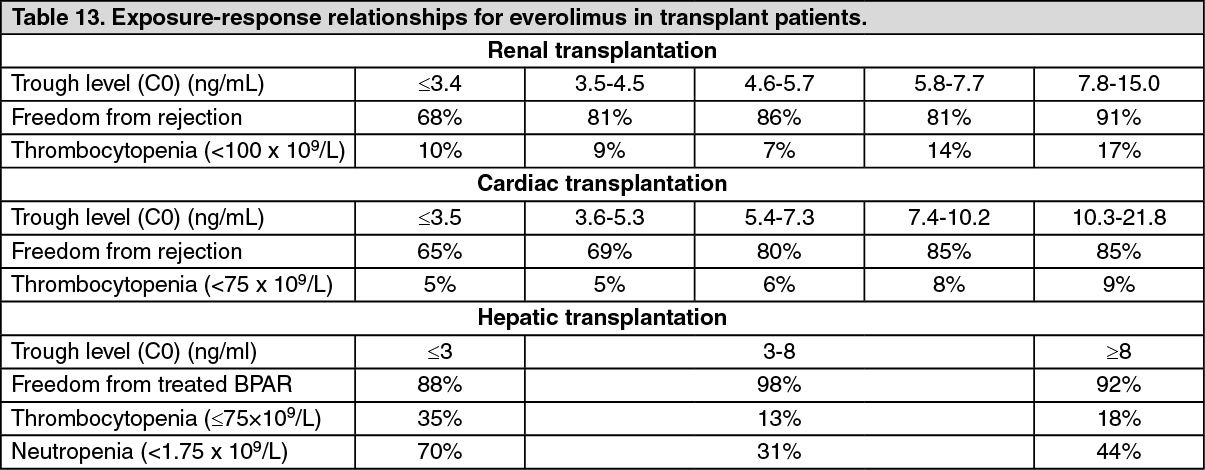
Exposure-response relationships: The average everolimus trough concentration (C0) over the first 6 months post-transplant was related to the incidence of biopsy-confirmed acute rejection and of thrombocytopenia in renal and cardiac transplant patients (see Table 13). In hepatic transplant patients the relationship of everolimus trough concentrations and clinical events is less well defined, however, higher exposures do not correlate with increase in adverse events. (see Table 13).
 Click on icon to see table/diagram/image
Toxicology: Non-Clinical Safety Data: The non-clinical safety profile of everolimus was assessed in mice, rats, minipigs, monkeys and rabbits. The major target organs were male and female reproductive systems (testicular tubular degeneration, reduced sperm content in epididymides and uterine atrophy) in several species, and, only in rats, lungs (increased alveolar macrophages) and eyes (lenticular anterior suture line opacities). Minor kidney changes were seen in the rat (exacerbation of age-related lipofuscin in tubular epithelium) and the mouse (exacerbation of background lesions). There was no indication of kidney toxicity in monkeys or minipigs.
Everolimus appeared to spontaneously exacerbate background diseases (chronic myocarditis in rats, coxsackie virus infection of plasma and heart in monkeys, coccidian infestation of GI tract in minipigs, skin lesions in mice and monkeys). These findings were generally observed at systemic exposure levels within the range of therapeutic exposure or above, with the exception of findings in rats, which occurred below therapeutic exposure due to a high tissue distribution.
Ciclosporin in combination with everolimus caused higher systemic exposure to everolimus and increased toxicity. There were no new target organs in the rat. Monkeys showed hemorrhage and arteritis in several organs.
In a male fertility study in rats, testicular morphology was affected at 0.5 mg/kg and above, and sperm motility, sperm head count and plasma testosterone levels were diminished at 5 mg/kg which is within the range of therapeutic exposure and caused a decrease in male fertility. There was evidence of reversibility.
Genotoxicity studies covering relevant genotoxicity end-points showed no evidence of clastogenic or mutagenic activity. Administration of everolimus for up to 2 years did not indicate any oncogenic potential in mice and rats up to the highest doses corresponding respectively to 8.6 and 0.3 times the estimated clinical exposure.