


 Sign Out
PHARMACOLOGY: Pharmacodynamics: Mechanism of action: Pemafibrate activates PPARα by binding to this receptor and regulates the target gene expression, leading to decreased plasma triglyceride (TG) concentration, decreased triglyceride-rich lipoprotein, decreased apolipoprotein (Apo) C-3, and increased HDL-cholesterol.
(1) The activation of PPARα by pemafibrate was more potent than the activation of PPARγ or PPARδ, indicating the selectivity of pemafibrate to PPARα (in vitro).
(2) Pemafibrate inhibited TG synthesis in the liver (rats).
(3) Pemafibrate significantly reduced TG secretory rate (rats).
(4) Pemafibrate increased LPL activity (rats).
(5) Pemafibrate significantly reduced plasma concentrations of ApoC-3 and Angiopoietin-like Protein 3, which negatively regulate LPL activity; moreover, pemafibrate inhibited the gene expression (Apoc3, Angptl3) in the liver. In addition, pemafibrate upregulated the expression of genes (Aco, Cpt1a) involved in β-oxidation of free fatty acids that inhibits LPL activity (rats).
(6) Pemafibrate facilitated plasma TG clearance (rats).
(7) Pemafibrate increased plasma concentration of fibroblast growth factor 21 (FGF21), a protein that reduces TG concentration and increases HDL-cholesterol concentration (rats).
Pharmacodynamic effects: Pharmacological action: (1) Effect of reducing plasma lipid: When pemafibrate was orally administered to rats with high fructose-induced hypertriglyceridemia, plasma TG concentration was decreased in a dose-dependent manner.
(2) Effect of increasing HDL-cholesterol: When pemafibrate was orally administered to human ApoA-1 transgenic mice, plasma concentration of HDL-cholesterol and concentration of human ApoA-1 were increased.
(3) Anti-arteriosclerotic effect: When pemafibrate was orally administered to LDL-receptor deficient mice under high fat/high cholesterol diet, the area of lipid deposition area in the aortic sinus was decreased.
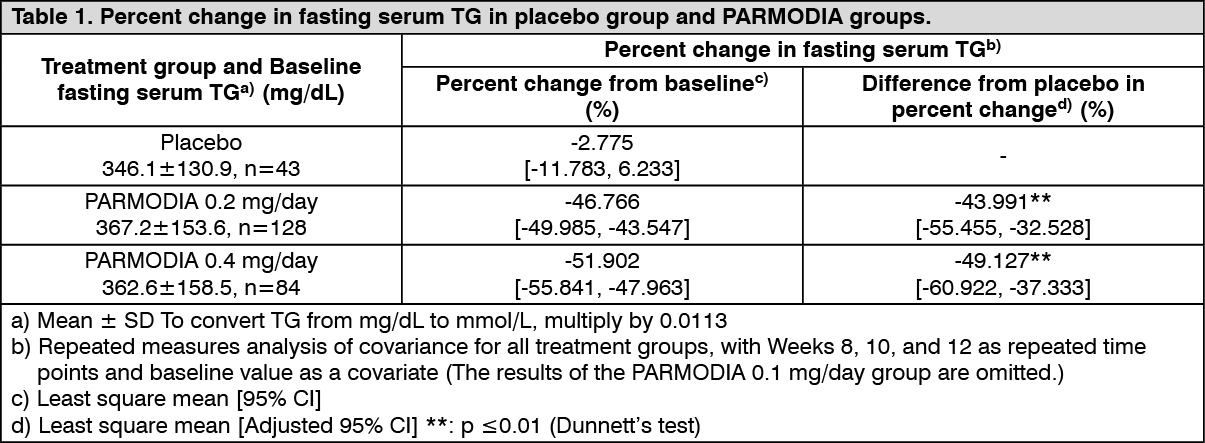
Clinical efficacy: Phase 2/3 Comparative Confirmatory Study with Fenofibrate: In patients with dyslipidemia who had high TG and low HDL-cholesterol levels, placebo, 0.2 mg/day or 0.4 mg/day of PARMODIA (twice daily after breakfast and dinner), or micronized fenofibrate capsules of 100 mg/day or 200 mg/day (once daily after breakfast) was administered for 12 weeks. The percent change in fasting serum TG was as presented in the following table, which shows the superiority of PARMODIA groups over the placebo group, and non-inferiority of PARMODIA 0.2 mg/day and 0.4 mg/day groups over the micronized fenofibrate capsule 200 mg/day group. (See Tables 1 and 2.)
 Click on icon to see table/diagram/image
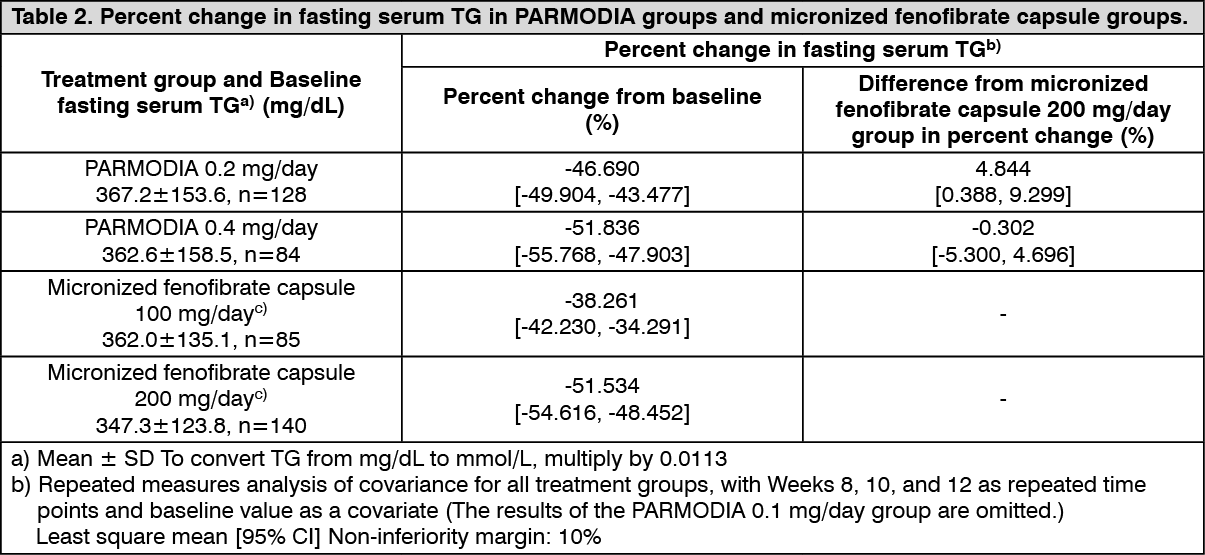 Click on icon to see table/diagram/image
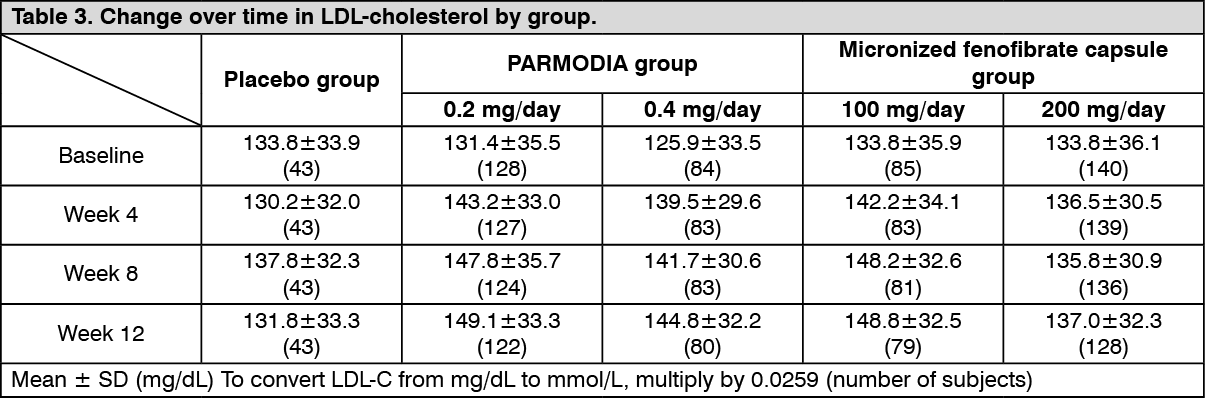
The change over time in LDL-cholesterol was as presented in the following table. (See Table 3.)
 Click on icon to see table/diagram/image
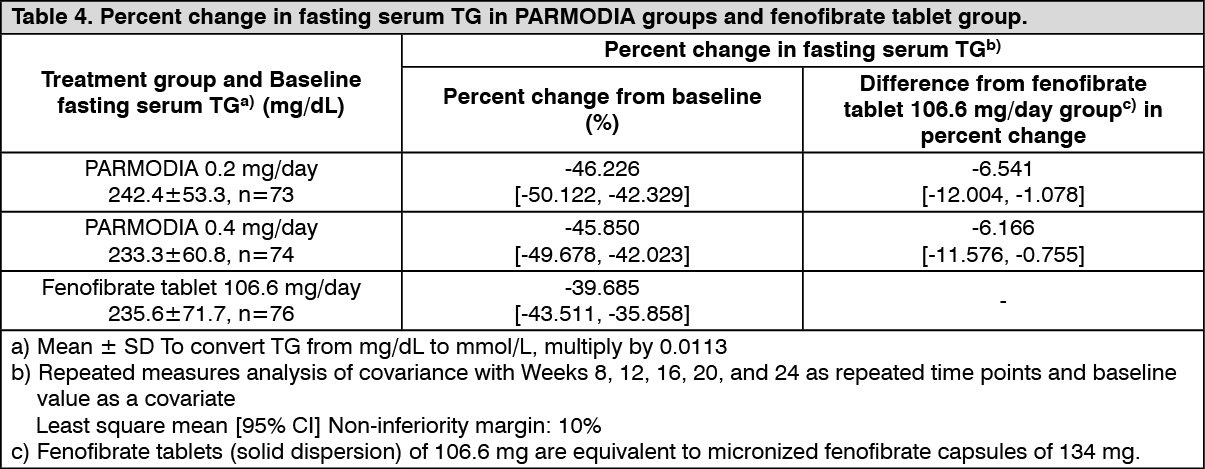
Phase 3 Comparative Confirmatory Study with Fenofibrate: In patients with dyslipidemia who had high TG and low HDL-cholesterol levels, placebo, 0.2 mg/day or 0.4 mg/day of PARMODIA (twice daily after breakfast and dinner), or fenofibrate tablets of 106.6 mg/day (once daily after breakfast) was administered for 24 weeks. The fenofibrate tablets (solid dispersion) of 106.6 mg are equivalent to micronized fenofibrate capsules of 134 mg. The percent change in fasting serum TG was as presented in the following table, which shows the non-inferiority of all PARMODIA groups over the fenofibrate tablet 106.6 mg/day group. (See Table 4.)
 Click on icon to see table/diagram/image
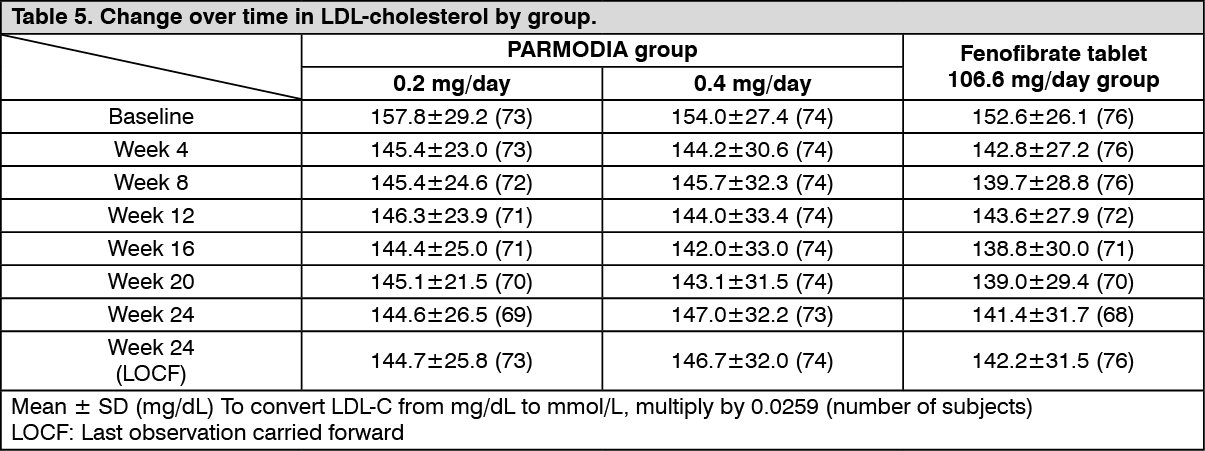
The change over time in the LDL-cholesterol was as presented in the following table. (See Table 5.)
 Click on icon to see table/diagram/image
Phase 3 Long-term Administration Study in Dyslipidemia Patients with High TG Levels: In patients with dyslipidemia who had high TG levels, PARMODIA 0.2 mg/day (a dose increase to PARMODIA 0.4 mg/day was allowed as necessary in subjects with inadequate response to PARMODIA 0.2 mg/day at Week 12 and after) was administered twice daily before or after breakfast and dinner for 52 weeks. The percent change from the baseline fasting serum TG of 249.7±77.5 mg/dL (2.82±0.88 mmol/L) (Mean ± SD [the same applies hereinafter], n=189) at Week 24 and Week 52 were -48.77±20.47% and -45.93±21.84%, respectively (Last observation carried forward [LOCF] method was used). LDL-cholesterol value was 119.3±31.7 mg/dL (3.09±0.82 mmol/L) at baseline, and 116.6±29.1 mg/dL (3.02±0.75 mmol/L) at Week 52 (n=189).
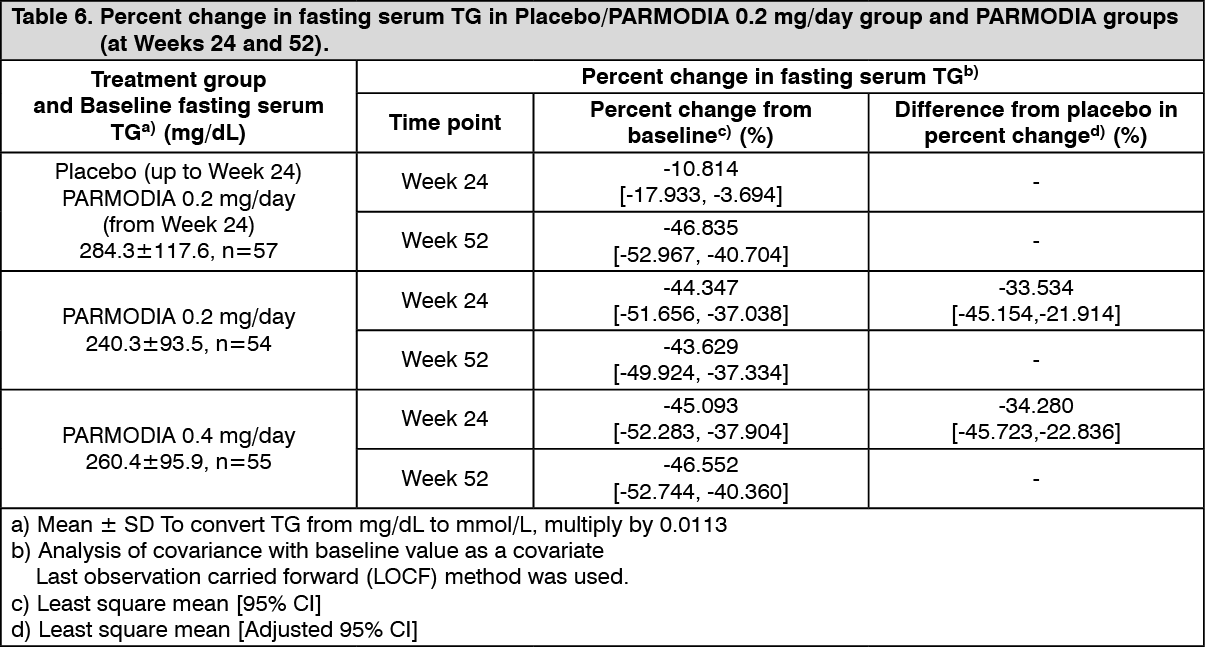
Phase 3 Long-term Administration Study in Patients with Dyslipidemia and Type 2 Diabetes Mellitus: In patients with dyslipidemia and type 2 diabetes mellitus, placebo/PARMODIA 0.2 mg/day (starting from Week 24, the treatment was switched from placebo to PARMODIA 0.2 mg/day), PARMODIA 0.2 mg/day, or PARMODIA 0.4 mg/day was administered twice daily before or after breakfast and dinner for 52 weeks. The percent change in fasting serum TG at Week 24 and Week 52 (LOCF) was as presented in the following table. (See Table 6.)
 Click on icon to see table/diagram/image
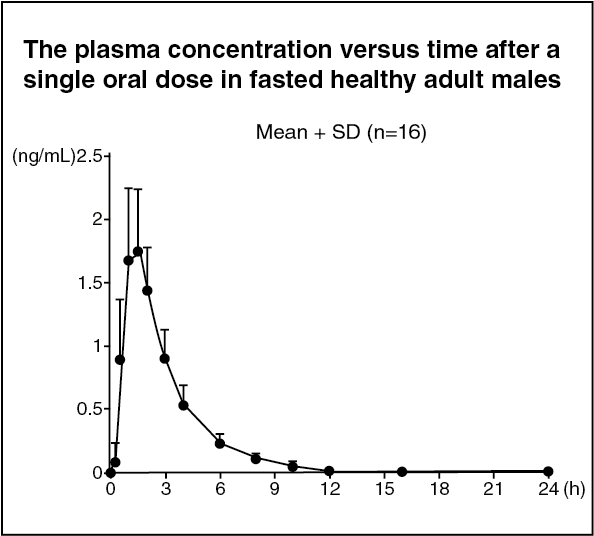
Pharmacokinetics: Plasma pemafibrate concentration: (1) Single dose administration: When a single dose of PARMODIA 0.1 mg was orally administered under fasted conditions to healthy Japanese adult males (16 subjects), the plasma concentration versus time and pharmacokinetic parameters are as presented in the following figure. (See figure and Table 7.)
 Click on icon to see table/diagram/image
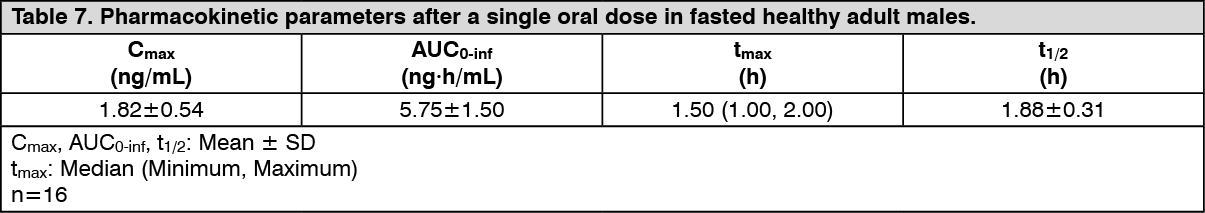 Click on icon to see table/diagram/image
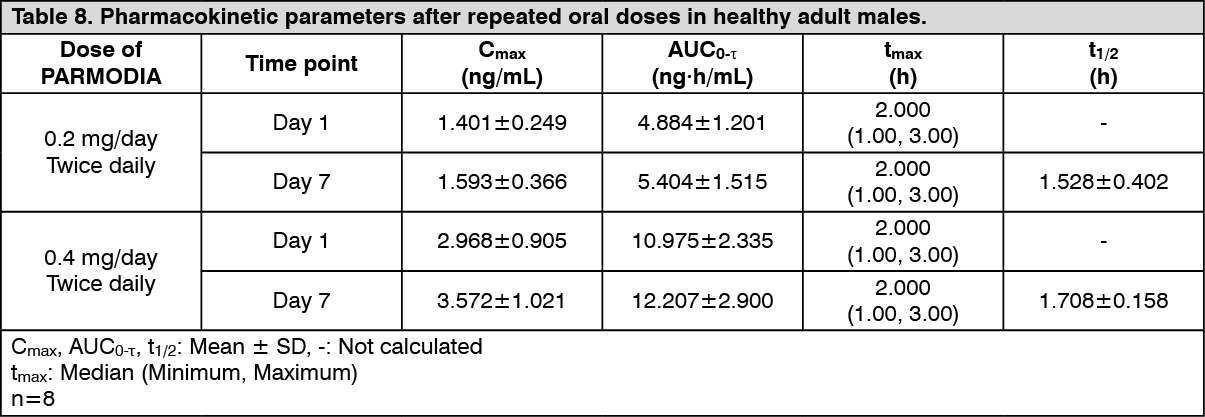
(2) Repeated dose administration: When PARMODIA 0.2 mg/day or 0.4 mg/day was orally administered twice daily after breakfast and dinner for 7 days to healthy Japanese adult males (8 subjects), the pharmacokinetic parameters on Day 1 and Day 7 are as presented in the following table. The plasma concentration reached a steady state on Day 2. The accumulation ratio based on AUC0-τ (repeated dosing/initial dosing, Mean ± SD) were 1.0997±0.0688 and 1.1169±0.1814, respectively. (See Table 8.)
 Click on icon to see table/diagram/image
(3) Food effect: When a single dose of PARMODIA 0.1 mg was orally administered to healthy Japanese adult males (16 subjects), the ratio [90% CI] of geometric means of fasted state to fed state for Cmax and AUC0-t were 0.873 [0.803, 0.950] and 0.911 [0.863, 0.961].
Absorption: The absolute bioavailability of pemafibrate was 61.5% (Data for non-Japanese subjects).
Plasma protein binding ratio: The human plasma protein binding ratio of pemafibrate was ≥99%.
Metabolism: (1) When a single dose of 14C-pemafibrate was orally administered to healthy adult subjects, the main metabolites in plasma were an oxidized form at the benzyl position, and a mixture of glucuronide conjugate of dicarboxylated form and N-dealkylated form (Data for non-Japanese subjects).
(2) Pemafibrate is a substrate of CYP2C8, CYP2C9, CYP3A4, CYP3A7, UGT1A1, UGT1A3, and UGT1A8 (in vitro).
Excretion: (1) When a single dose of 14C-pemafibrate was administered to healthy adult subjects, excretion of radioactivity in urine and feces up to 216 hours after administration was 14.53% and 73.29%, respectively (Data for non-Japanese subjects). Pemafibrate is excreted mainly in the feces.
(2) Pemafibrate is a substrate of P-gp, BCRP, OATP1A2, OATP1B1, OATP1B3, OCT2, and NTCP (in vitro).
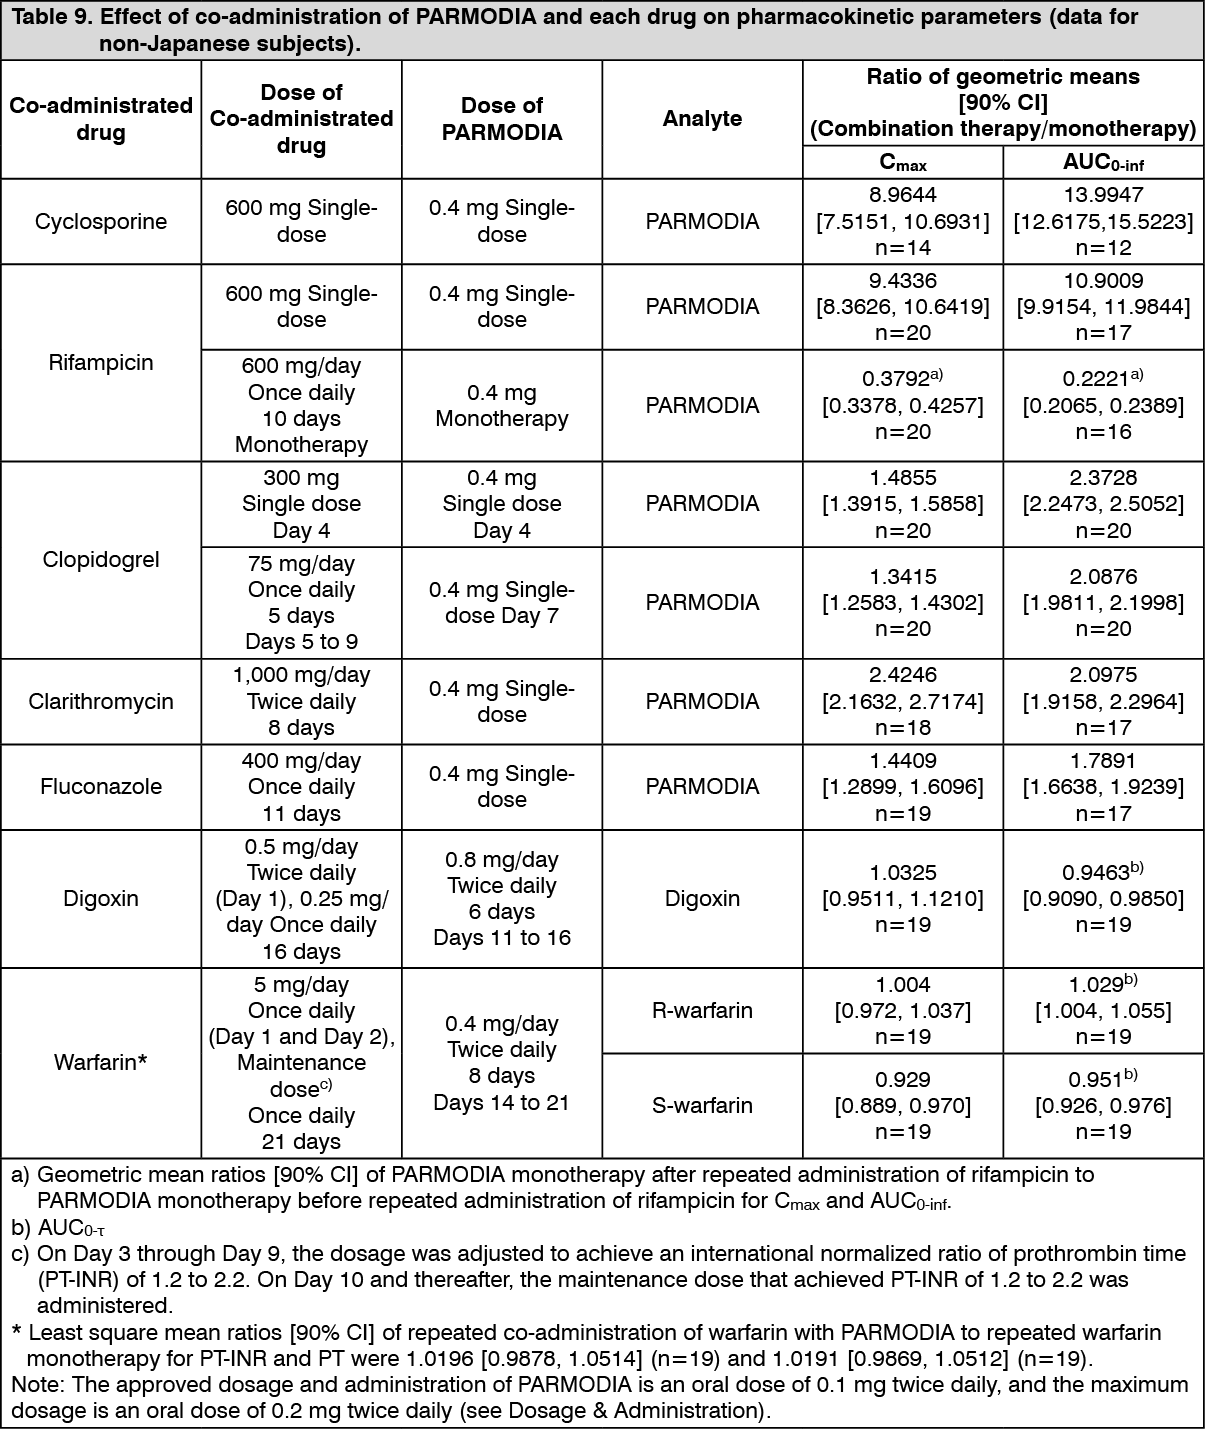
Drug interactions: (1) Co-administration with cyclosporin, rifampicin, clopidogrel, clarithromycin, fluconazole, digoxin, or warfarin: When PARMODIA was co-administered with each drug in healthy adult subjects (non-Japanese), the effect on the pharmacokinetic parameters was as presented in the following table. (See Table 9.)
 Click on icon to see table/diagram/image
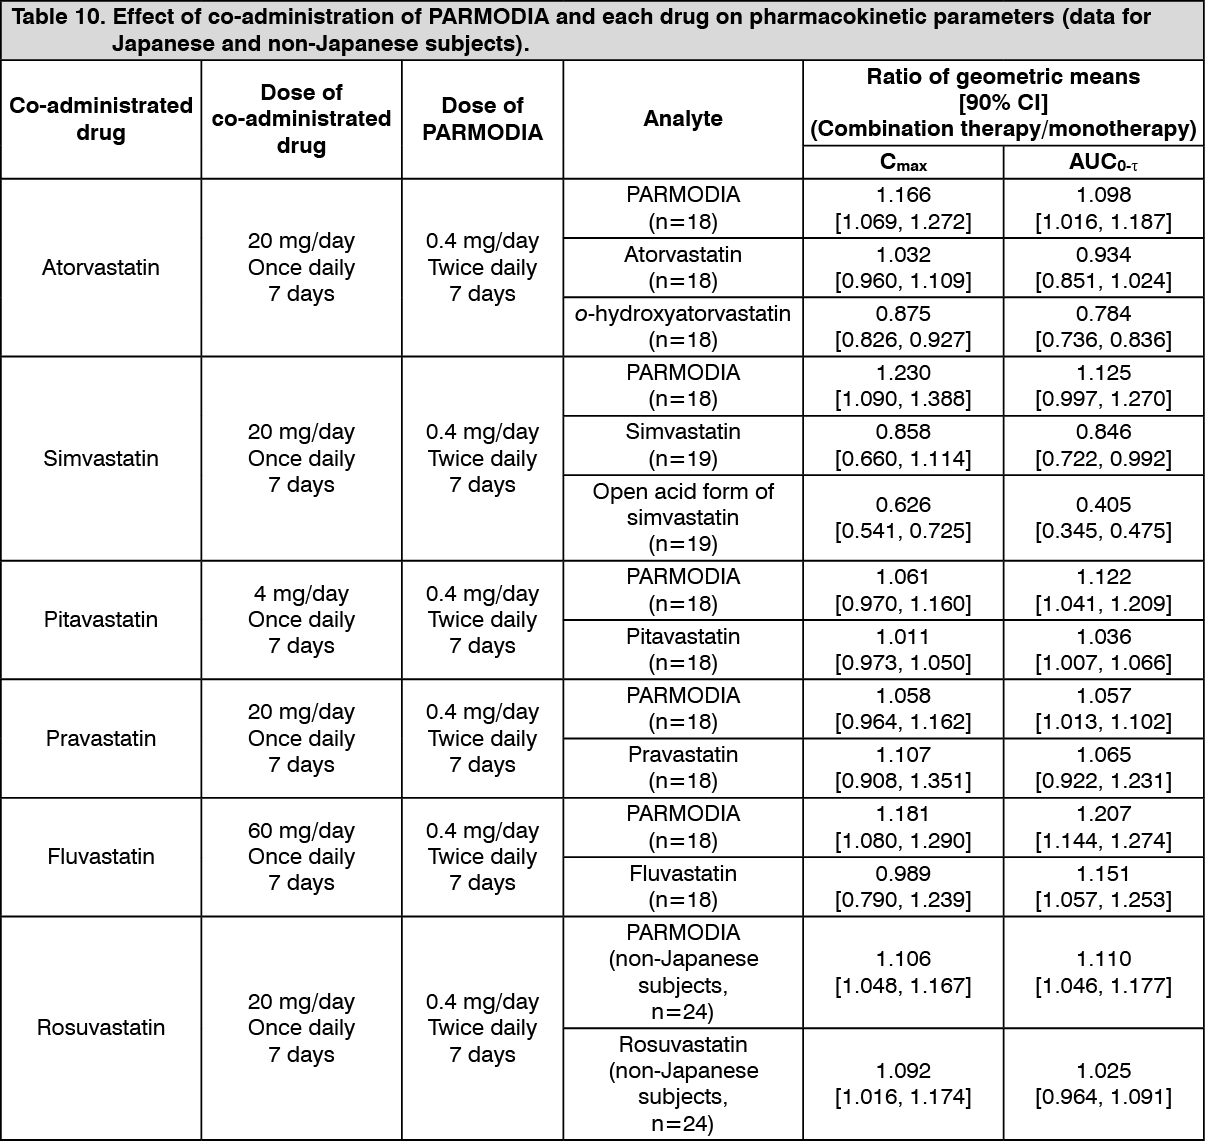
(2) Co-administration with HMG-CoA reductase inhibitors: When PARMODIA and HMG-CoA reductase inhibitors were co-administered to healthy adult males (Japanese and non-Japanese), the effect of co-administration on the pharmacokinetic parameters was as presented in the following table. (See Table 10.)
 Click on icon to see table/diagram/image
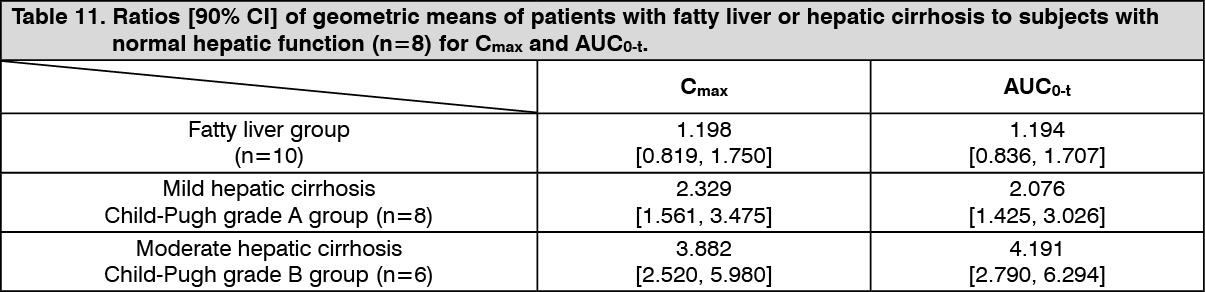
Special populations: Pharmacokinetics in Patients with Fatty Liver and Patients with Hepatic Cirrhosis: When a single dose of PARMODIA 0.2 mg was orally administered to Japanese patients with fatty liver and patients with hepatic cirrhosis, the ratios of pharmacokinetic parameters (patients with fatty liver or with hepatic cirrhosis to subjects with normal hepatic function) were as presented in the following table. Compared with subjects with normal hepatic function, the exposure was higher in patients with fatty liver and patients with hepatic cirrhosis. (See Table 11.)
 Click on icon to see table/diagram/image
Pharmacokinetics in Patients with Renal Impairment: When a single dose of PARMODIA 0.2 mg was orally administered to Japanese patients with renal impairment (mild, moderate, severe, or end-stage renal failure), the ratios of pharmacokinetic parameters (patients with renal impairment to subjects with normal renal function) were as presented in the following table. Compared with subjects with normal renal function, the exposure was higher in patients with renal impairment; however, the exposure did not increase as the renal function reduced. (See Table 12.)
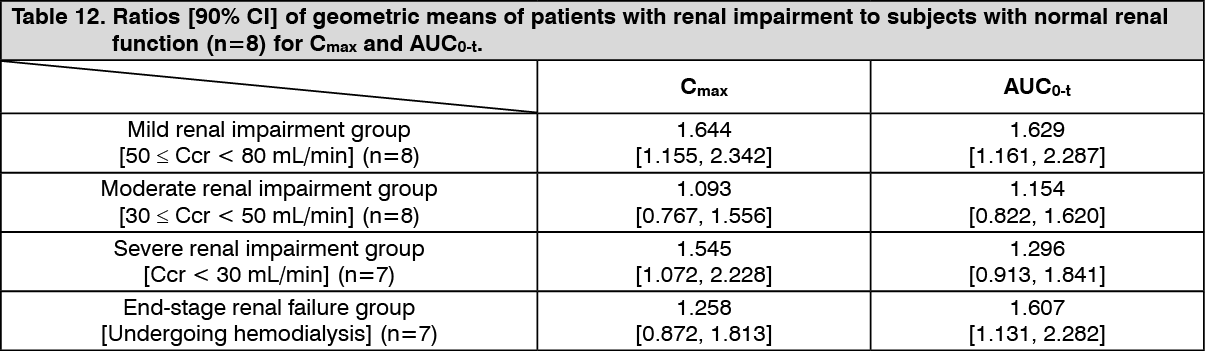 Click on icon to see table/diagram/image
PARMODIA was orally administered at a dose of 0.1 mg twice daily in morning and evening for 12 weeks to patients with dyslipidemia accompanied by high TG value and renal impairment (severe renal impairment with eGFR <30 mL/min/1.73 m2 or on dialysis and mild-to-moderate renal impairment with eGFR ≥30 and <60 mL/min/1.73 m2). The ratio and 90% CI of geometric means of AUC0-τ in patients with severe renal impairment compared to those with mild-to-moderate renal impairment (control group) at Week 12 were as presented in the following table. The level of exposure did not increase in patients with severe renal impairment. (See Table 13.)
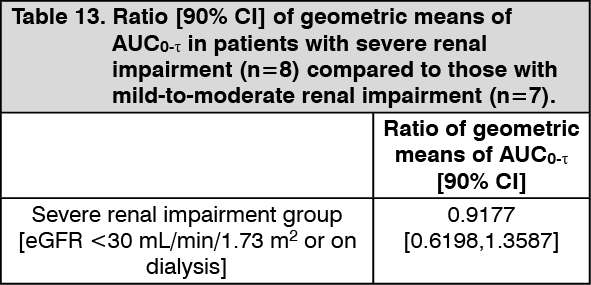 Click on icon to see table/diagram/image
Pharmacokinetic parameters were presented in the following table. (See Table 14.)
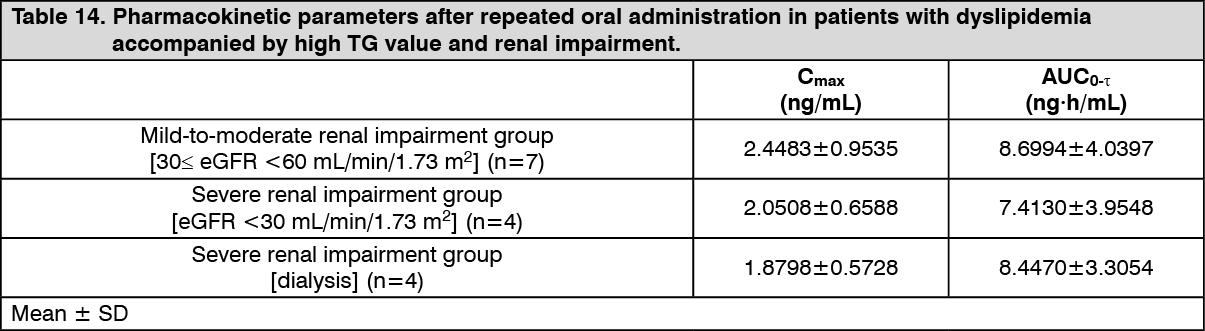 Click on icon to see table/diagram/image
Toxicology: Preclinical safety data: In a carcinogenicity study in mice (≥0.075 mg/kg/day), an increase in the incidence of hepatocellular carcinomas and hepatocellular adenomas was observed. In a carcinogenicity study in rats (≥0.3 mg/kg/day in male rats and ≥1 mg/kg/day in female rats), an increase in the incidence of hepatocellular carcinomas, hepatocellular adenomas, pancreatic acinar cell carcinomas, pancreatic acinar cell adenomas, testicular Leydig cell adenomas, and thyroidal follicular epithelial cell adenomas was observed. All of these findings are considered to be specific to rodents.